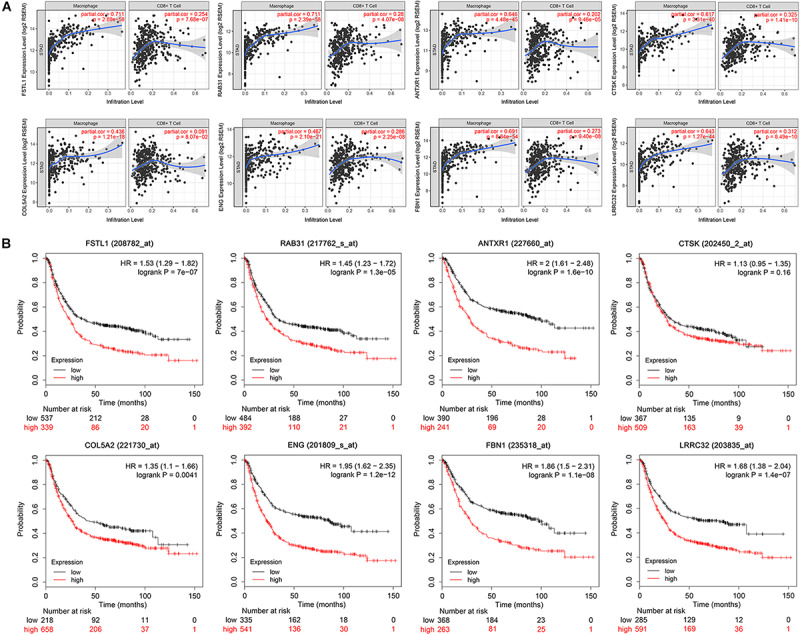
FIGURE 5.

Immune correlation and survival analysis of the eight hub genes. (A) Scatter plot showing a strong and positive correlation (Cor = 0.4–0.8, P < 0.05) between the expression level of eight selected hub genes and the macrophage infiltration level. CD8+T set as control. (B) Survival analysis validation of the eight hub genes in gastric cancer using Kaplan–Meier plotter.
