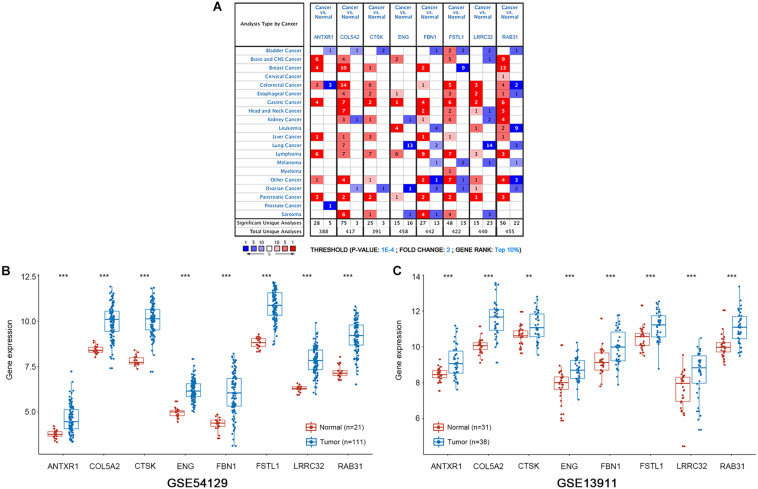
FIGURE 6.
mRNA expression patterns of the eight hub genes was verified with the Oncomine and GEO databases. (A) The Oncomine database shows the mRNA expression differences between various cancers and corresponding normal tissues. The threshold is shown at the bottom. The figure in the colored cell indicates the number of data sets satisfying the threshold. The red cells show that hub genes are overexpressed in tumor tissues, while the blue cells show that hub genes are downregulated in tumor tissues. (B,C) Boxplots show the expression of eight hub genes in gastric cancer and normal gastric tissues from GSE54129 and GSE13911 datasets. ***P < 0.001; **P < 0.01.

