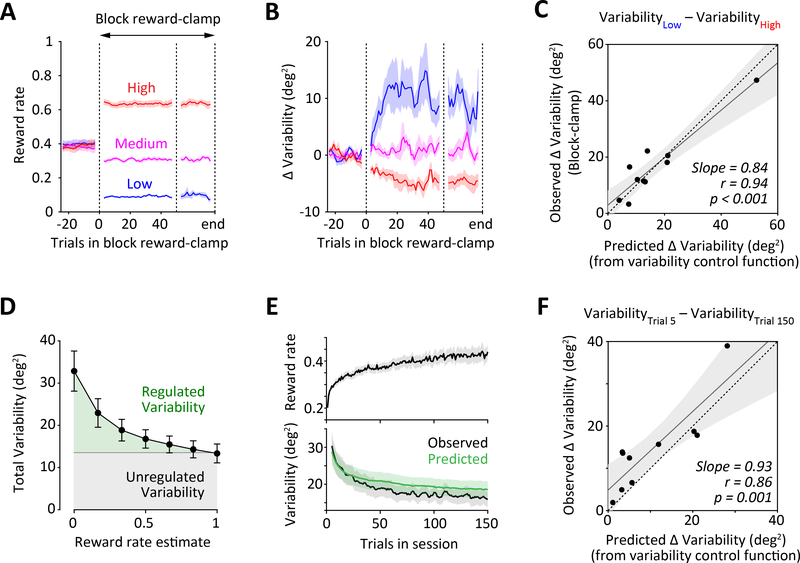
Figure 3: Single-trial analyses can predict macroscopic changes in motor variability.
A-B. Average reward rate (A) and variability (B) during block reward clamps in which probabilistic reward was delivered over 50–100 trial segments at three different reward rates (low, medium and high – indicated by colors). The reward delivery was independent of the press-angle. Lines show 5-trial moving window measurements that were first averaged across sessions for each rat and then across rats. Shading represents SEM across rats (n=10). See also Figure S3.
C. Comparing changes in average variability between the low and high reward rate block clamps, to predictions from the variability control functions derived from single-trial analyses (as in Figure 2D). Each dot represents an individual rat. Grey line is the regression line and dashed line represents unity. Shading represents 95% confidence intervals of the regression. A significant correlation is observed even after excluding the rat with the largest difference in variability (Slope = 0.824, r=0.73, p=0.025).
D. Comparing average levels of regulated (derived from single-trial analysis, green shading) and unregulated (derived from measurements in the block reward-clamp, grey shading) variability as a function of the reward rate estimate. Error bars represent SEM.
E. Average reward rate (top) and variability (bottom, black curve) as a function of trial number in a training session. Green curve shows variability predicted from reward history by the reward-dependent variability regulating process derived from single-trial analyses of probabilistic reward trials (see STAR Methods and Figures 1–2). Measurements and predictions have been averaged over sessions for each rat and then across rats. Shading represents SEM across rats (n=10).
F. Comparing changes in average variability over the time-course of a training session (between trials 5 and 150), to predictions from the reward-dependent variability regulating process derived from single-trial analyses of probabilistic reward trials (as in panel E, bottom plot). Each dot represents an individual rat. Grey line is the regression line and dashed line represents unity. Shading represents 95% confidence intervals of the regression.

