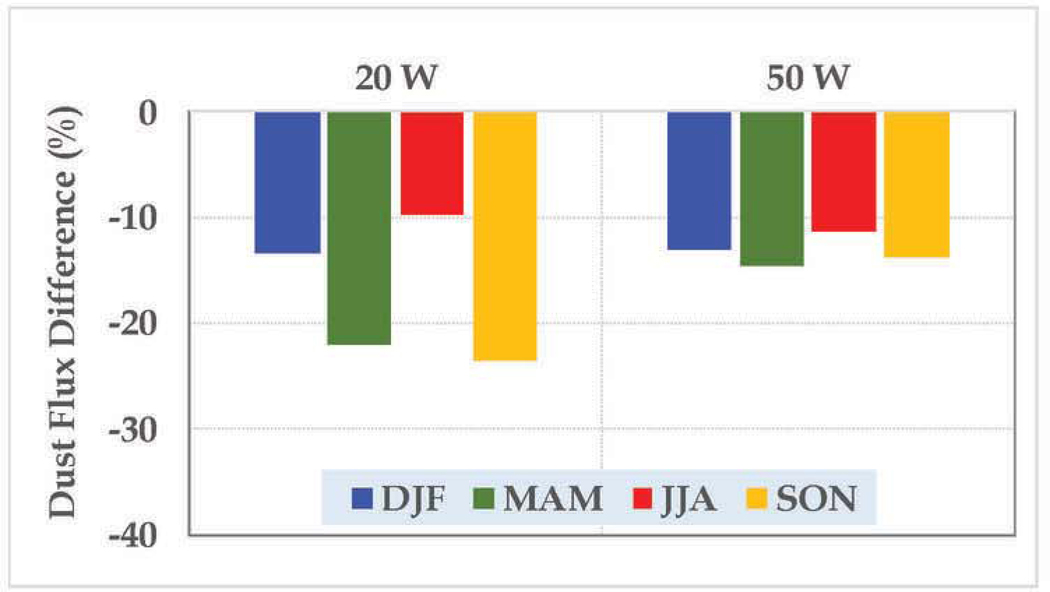
Figure 13:

Dust mass flux derived from the monthly dust and monthly wind field introducing a low bias of −10% to −23%, compared to that being aggregated up from instantaneous dust mass flux at each time step of MERRA2 simulation. MERRA2 outputs over one-year (12/2012–11/2013) are analyzed to compare the zonal dust mass fluxes integrated over the atmosphere columns between 0°N-30°N at longitudes of 20°W and 50°W, respectively.
