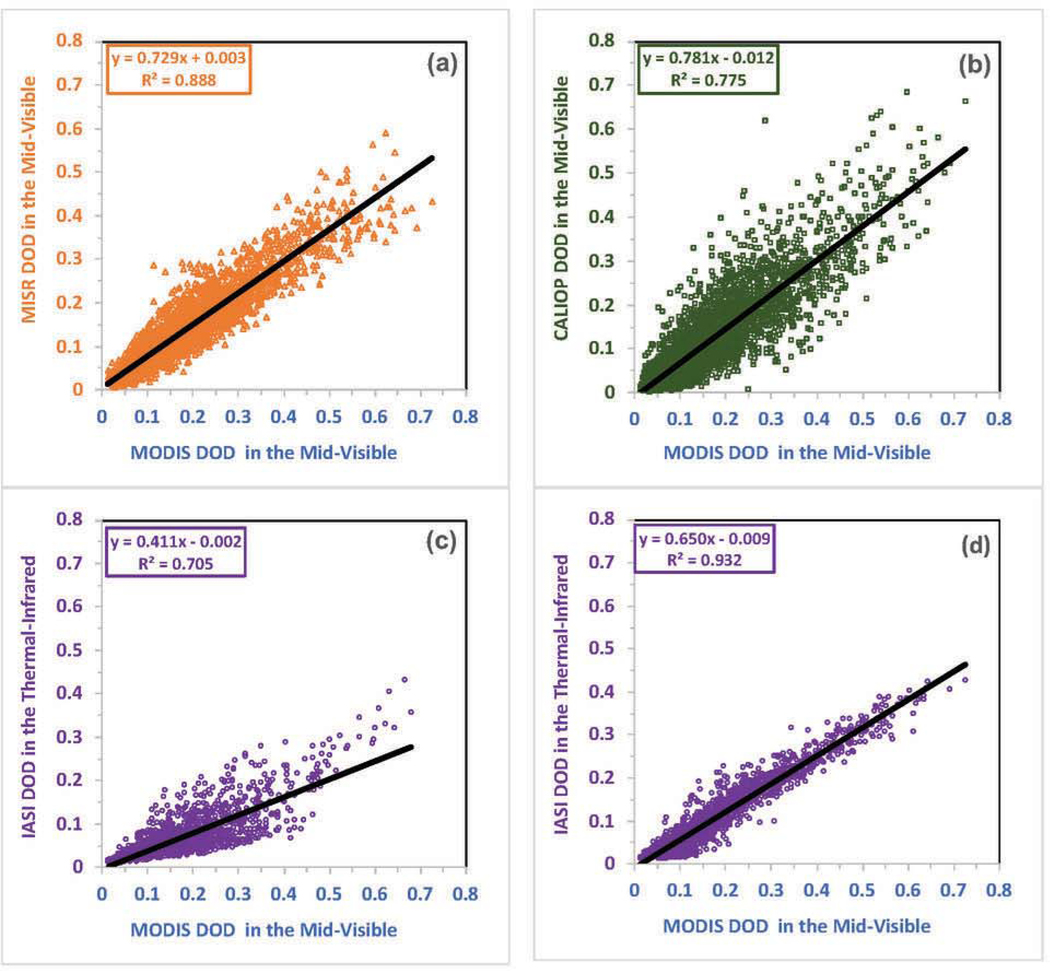
Figure 4:

Comparisons of MODIS-derived DOD at 0.55 μm with that derived from MISR (a, including all seasons, at 0.558 μm), CALIOP (b, including all seasons, at 0.532 μm), and IASI (c for DJF and MAM, and d for JJA and SON; at 10 μm) over eastern Atlantic Ocean (20W-50W, 0–30N). Each point in the scatterplots represents a seasonal mean DOD in one of the 5°x2° grids for a particular year.
