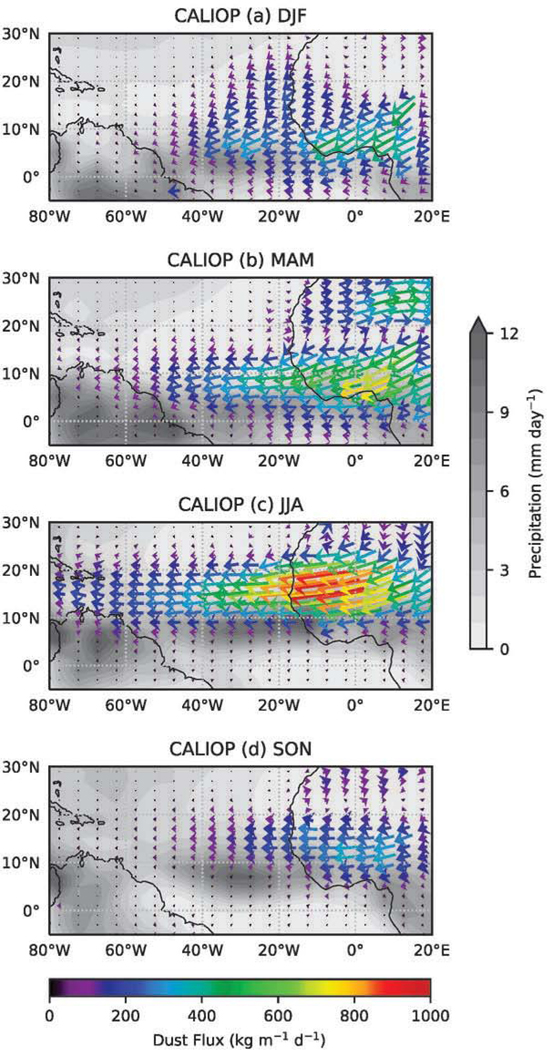
Figure 5:

A composite of vertical-column integrated zonal and meridional dust flux rates (kg m−1 d−1) derived from the CALIOP 2007–2016 climatology, showing the magnitude (color scale and vector length) and direction (arrow of vector) of dust transport in the atmosphere and its seasonal variations. The dust flux is overlaid on the GPCP precipitation rate (gray contours).
