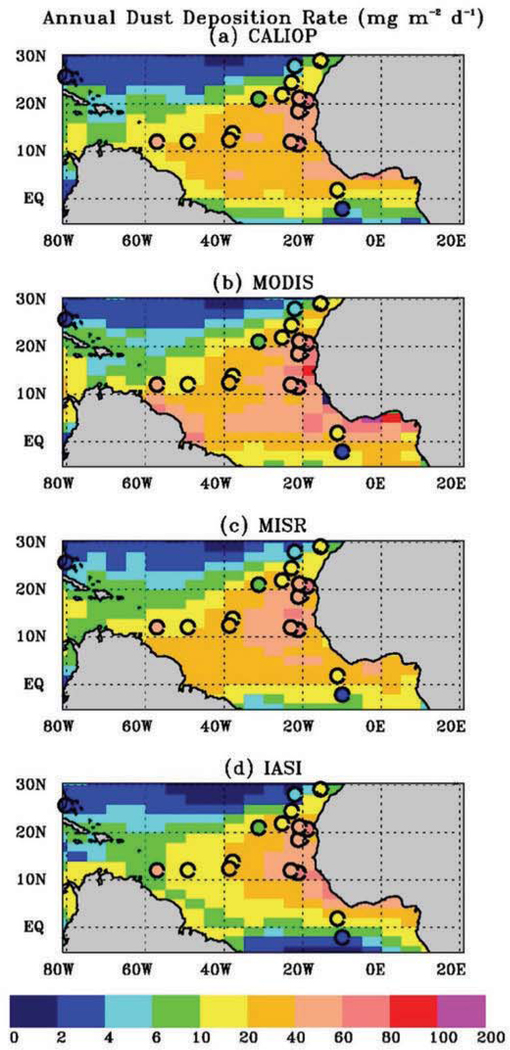
Figure 8:

2007–2016 average yearly dust deposition flux (unit: mg m−2 d−1) derived from aerosol observations by CALIOP (a), MODIS (b), MISR (c), and IASI (d). Black circles filled with colors representing the surface-based dust deposition climatology (see Table S1 for details) are overlaid on the maps.
