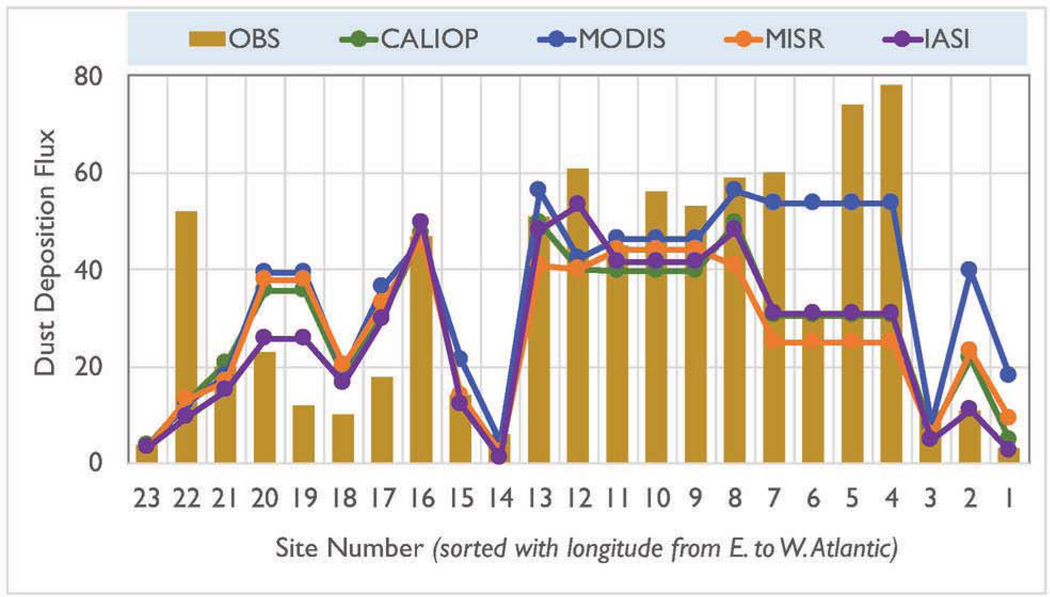
Figure 9:

Comparison of satellite-based estimates (colored lines) of annual dust deposition flux (unit: mg m−2 d−1) with the surface-based climatology (gray bars, denoted as OBS) at individual locations (the observation sites are sorted by longitude and numbered in ascending order from East Atlantic to West Atlantic, see Figure 1).
