
FIGURE 2:
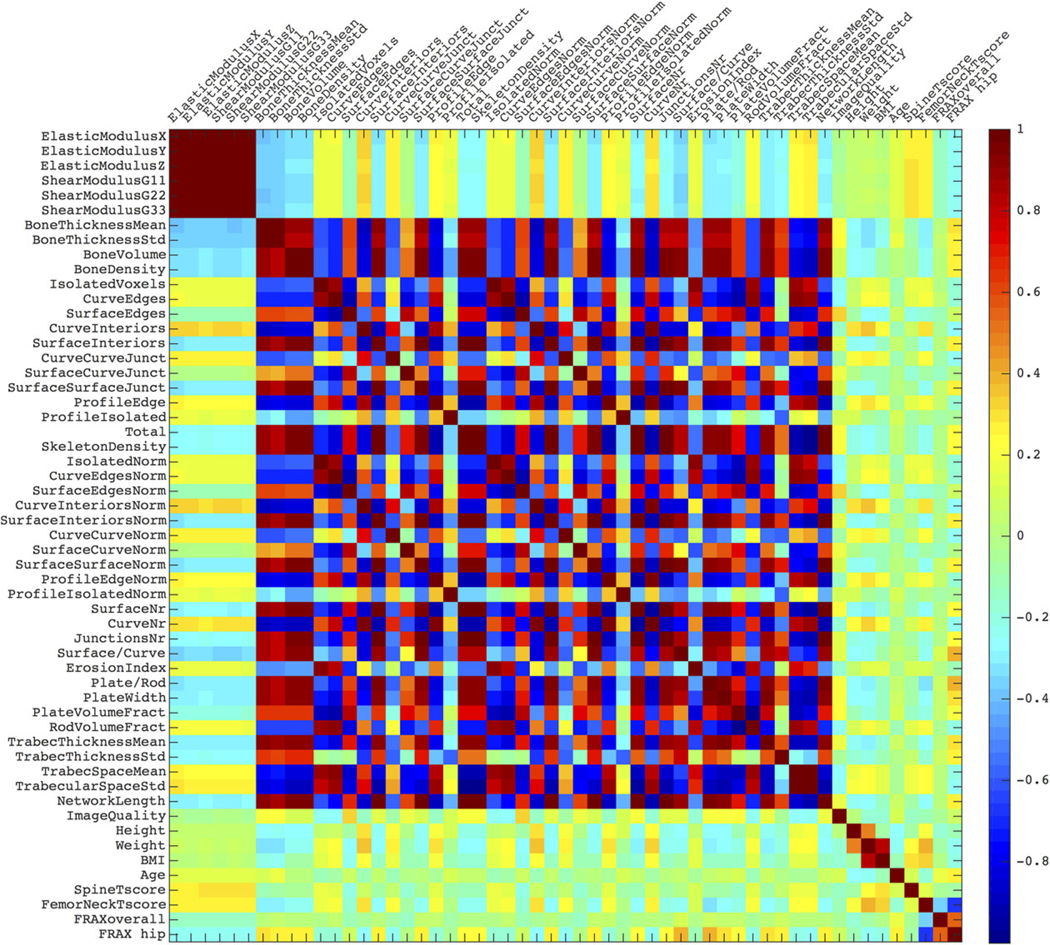
A positional variance diagram for the pairwise linear correlations between the features. The color scale indicates the correlation from 1 (strongly, positively correlated), through 0 (not correlated), to –1 (strongly, negatively correlated).