
FIGURE 4:
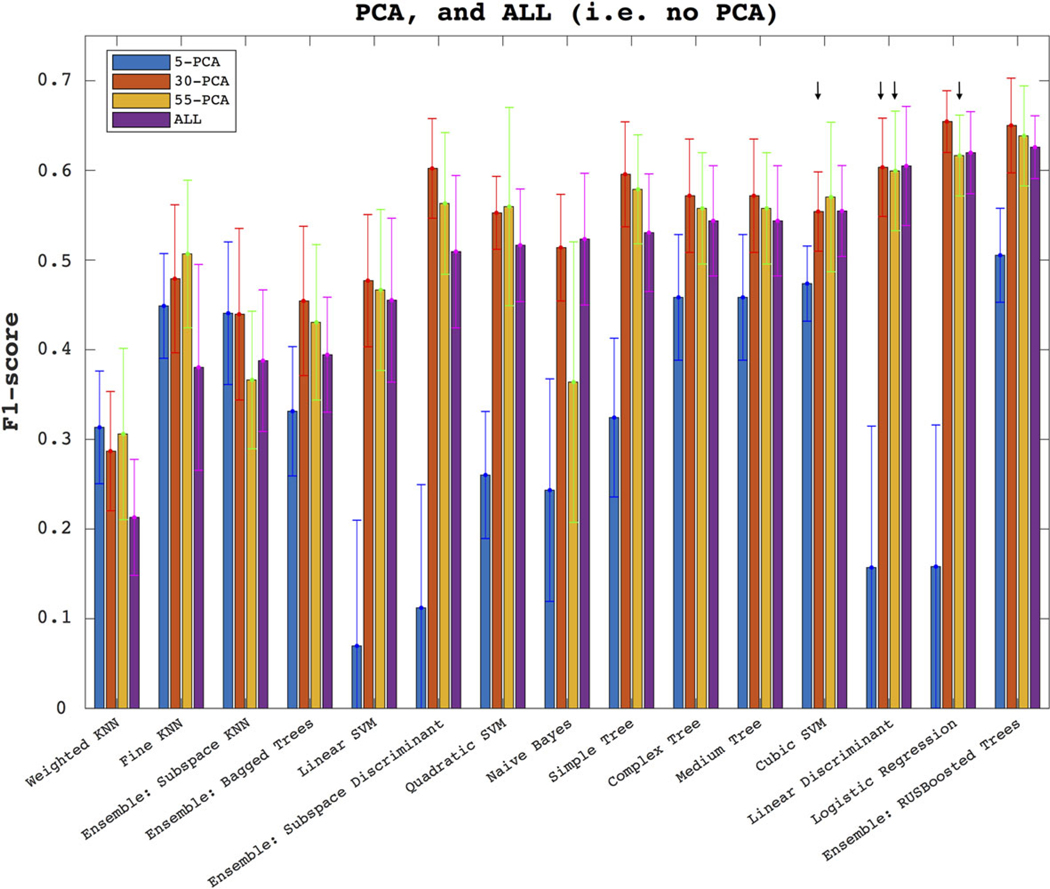
The plots show how the models perform through the F1-score, when using selected PCA components (first three bars on each classifier, as denoted in the legend), and the complete set of features (denoted in the legend as ALL, plotted in each classifier’s last bar). The results are averaged over the five anatomical subregions. In the legend, 5-PCA denotes a PCA with only five components, etc. The error bars denote the standard deviation around the mean across 200 random-seed initializations of the 23-fold CV. The arrows denote no statistically significant difference between the pointed population and that of ALL.