
FIGURE 5:
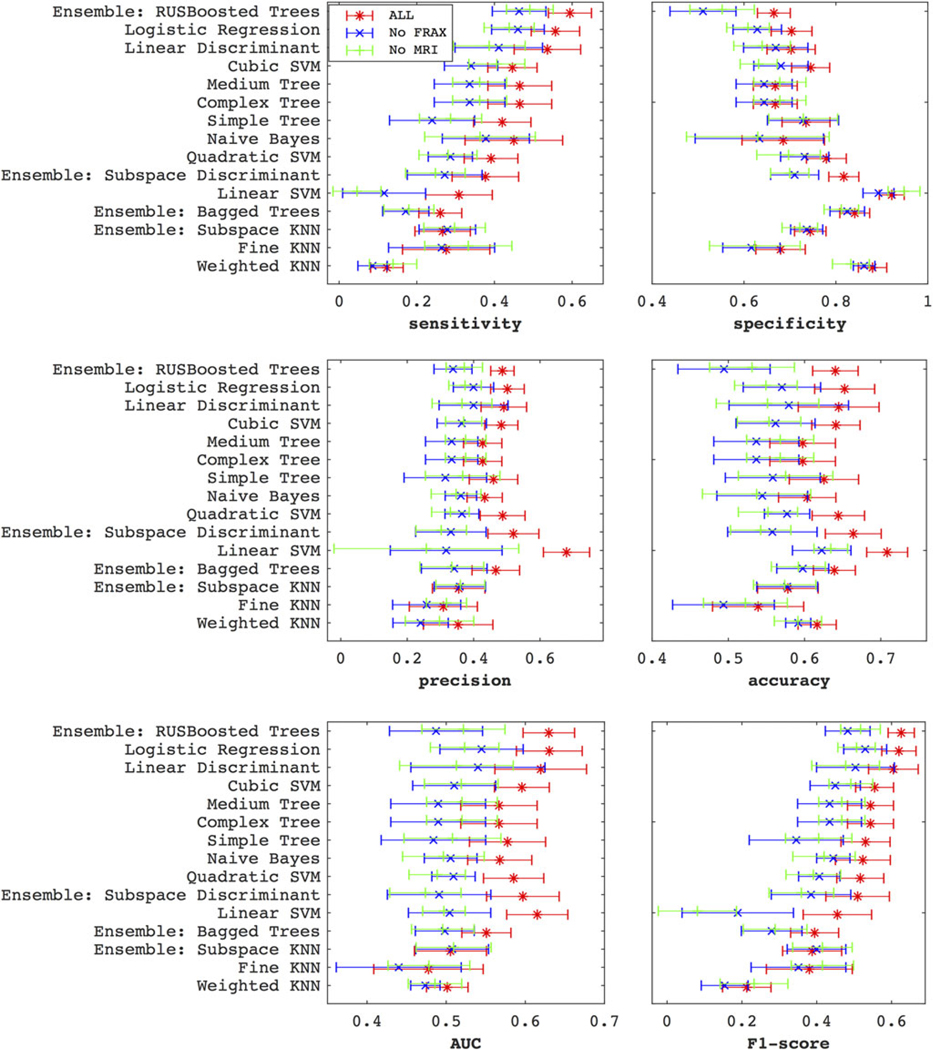
The plots show how the classifiers perform via the sensitivity, specificity, precision, accuracy, AUC, and F1-score metrics, after averaging over the five anatomical subregions. The classifiers are ordered by the F1-score ranking. Clearly, both MRI and FRAX improve performance. The trend of sensitivity across the classifiers runs in the opposite direction to that specificity.