
Figure 2. Determinants of IL-22 induction in acute OPC.
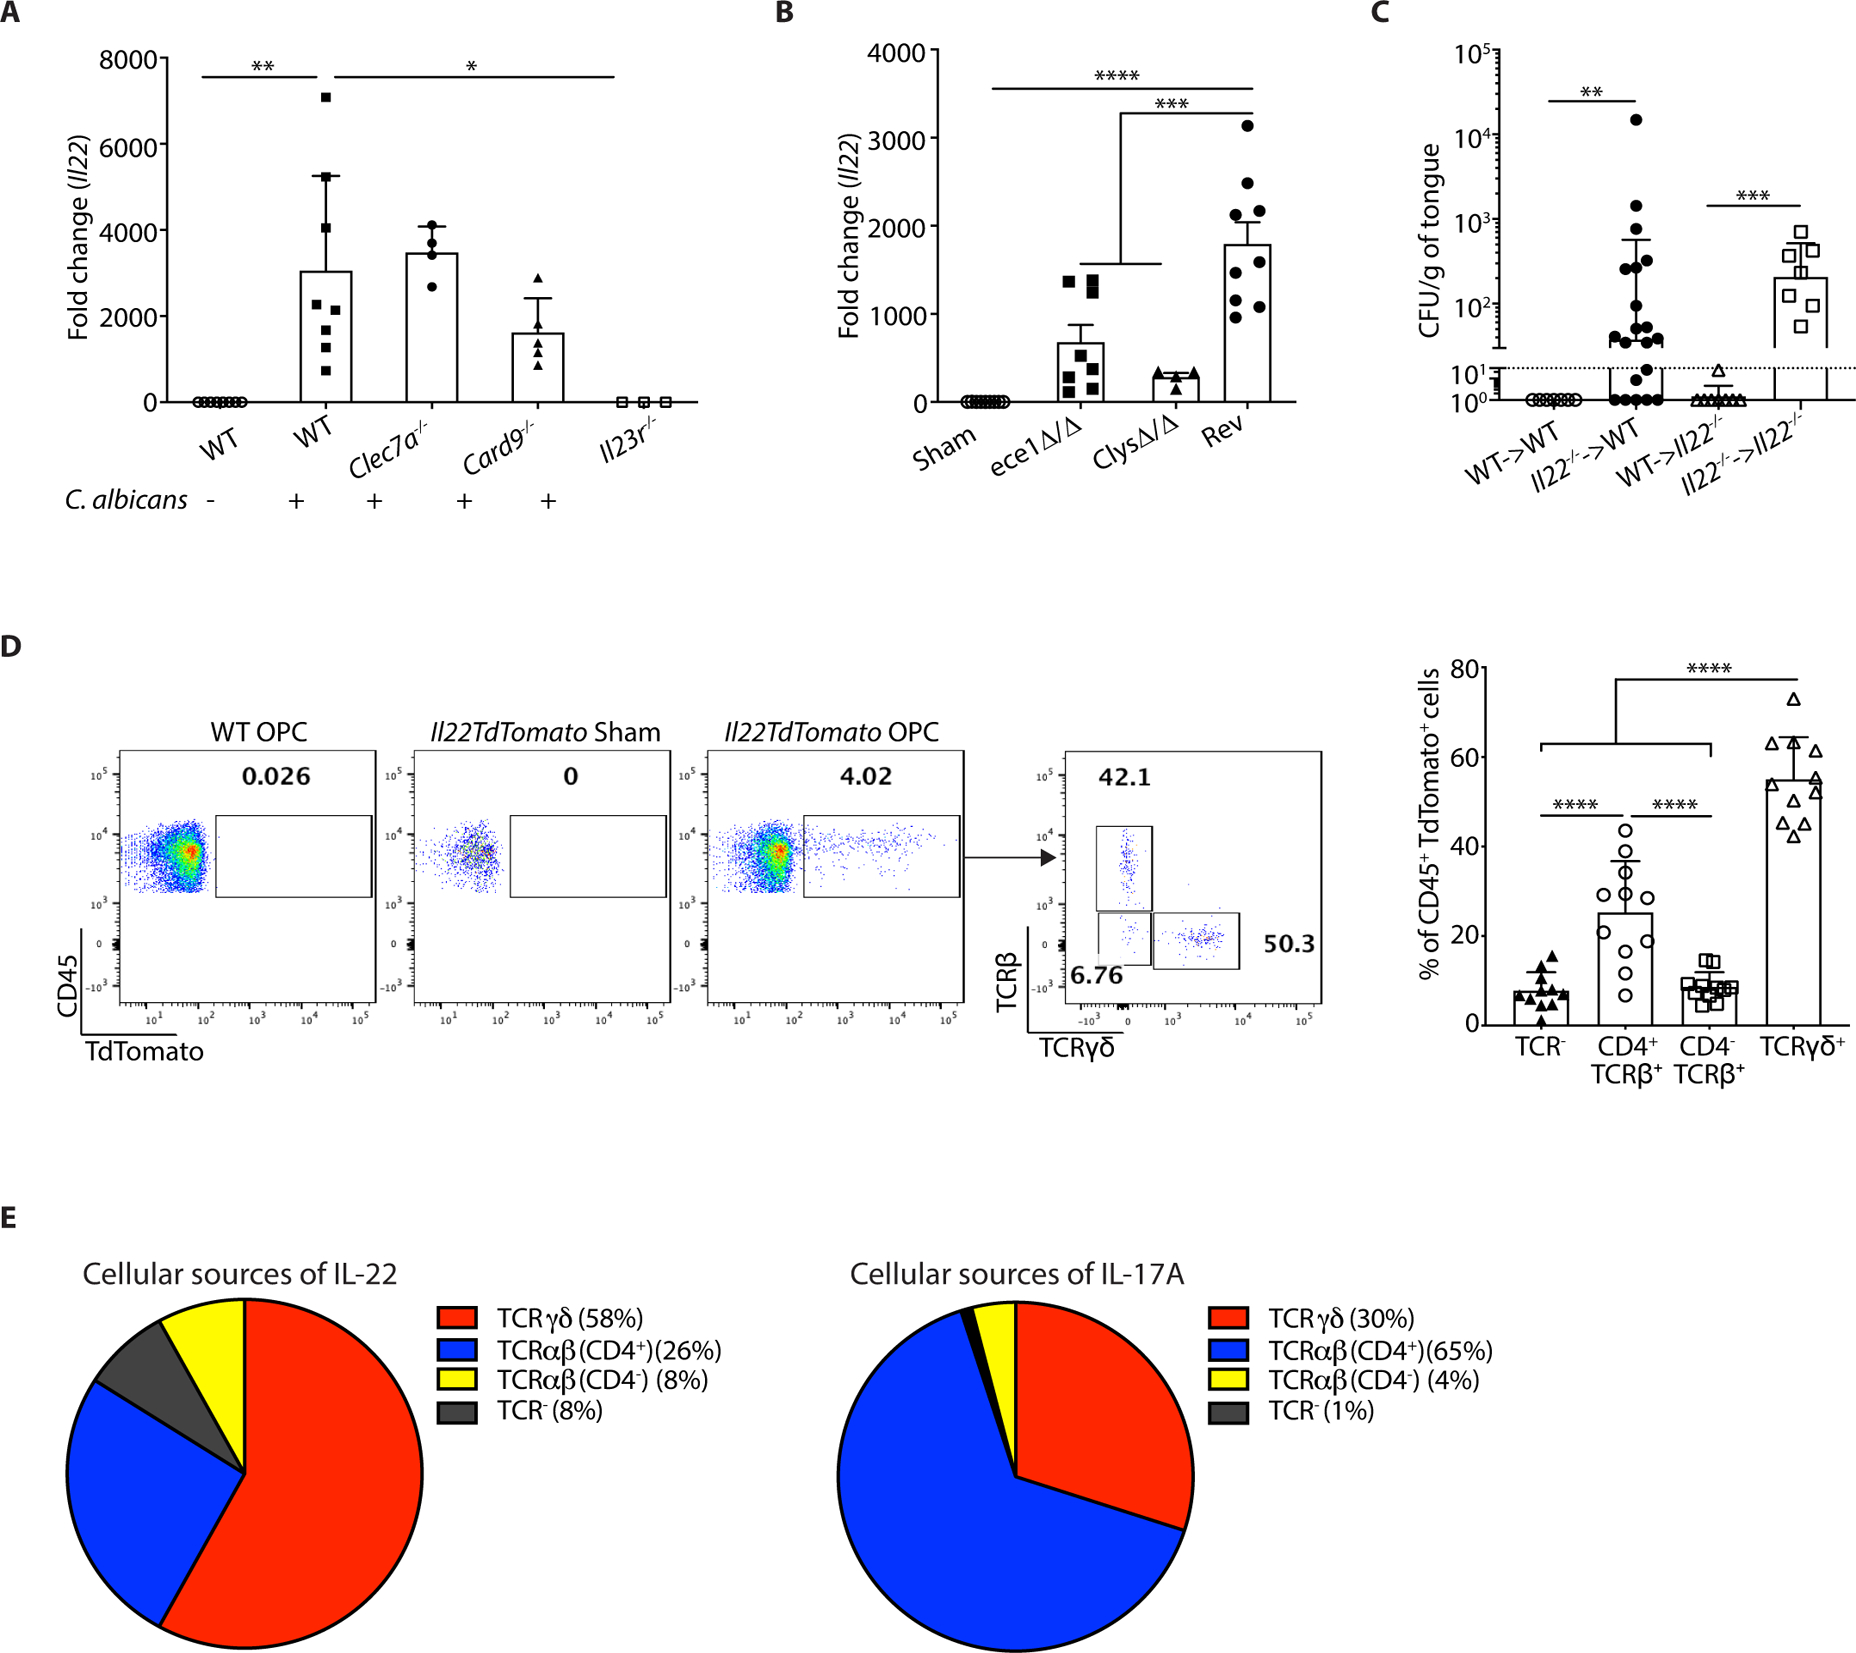
The indicated mice were subjected to OPC. Each symbol represents one mouse A. Tongues were harvested on day 2 p.i. and Il22 mRNA was assessed by qPCR, normalized to Gapdh. Graphs show mean ± SEM relative to sham-infected WT mice. B. WT mice were infected with the indicated C. albicans strains. Il22 mRNA in tongue on day 2 p.i. was assessed by qPCR, normalized to Gapdh. Data were pooled from 2 independent experiments. C. BM from indicated donors was transferred into irradiated recipients. After 6–9 weeks, mice were subjected to OPC and fungal burdens assessed on day 5 p.i. Data were pooled from 2 experiments. D. On day 2 p.i., tongue homogenates from IL22TdTomato mice were stained for the TCRβ and TCRγδ and gated on the live CD45+TdTomato+ population. Left: representative FACS plots. Right: Pooled results from 3 independent experiments. Each symbol represents data from 2 pooled tongues. Data were analyzed by ANOVA or Student’s t-test, with Mann-Whitney U test for fungal load analysis. E. Comparisons of the relative percentages of IL-22+ cells (left) or IL-17+ cells (data from (29)) isolated from tongues of mice 2 days p.i. and analyzed by flow cytometry.