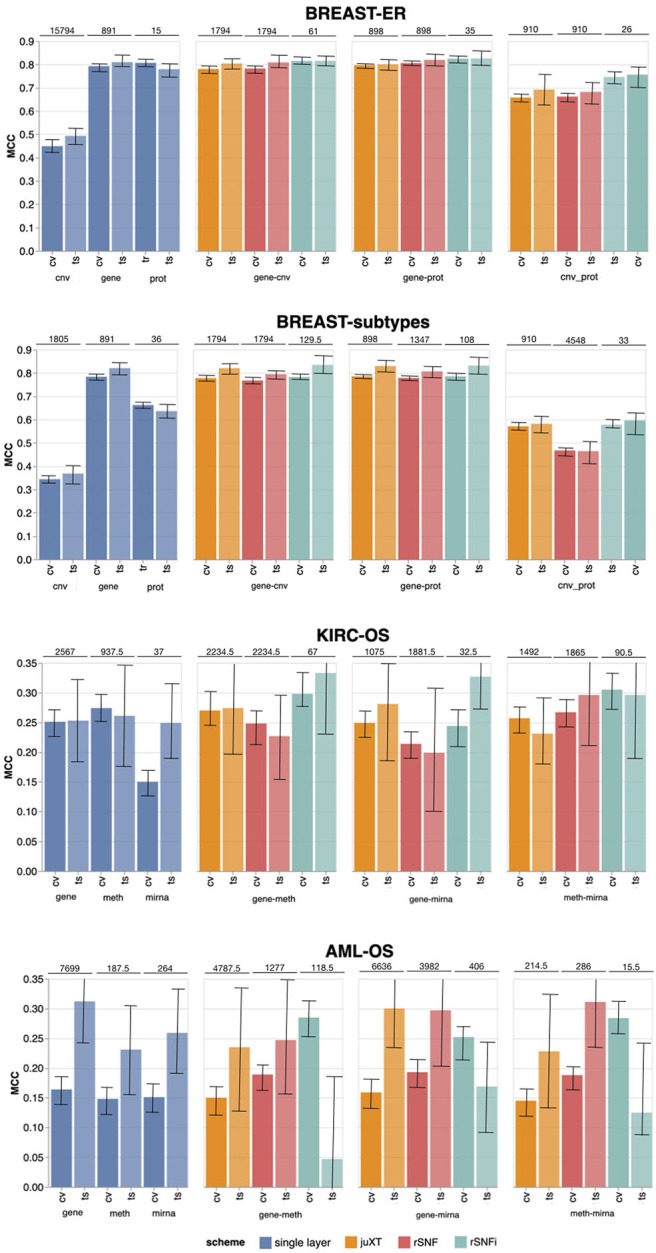
Figure 4.

Overview of Random Forest classification performance (MCC, Matthews Correlation Coefficient) on the four tasks in cross validation (“CV”) and test (“ts”), on single-layer (blue shades) and on all two-layer combinations for juXT (orange), rSNF (red) and rSNFi (green). Bars indicate 95% confidence intervals. On top of each CV-ts pair is the median number of features leading to best CV performance.
