
Figure 4. Forest Plots of Hazard Ratios.
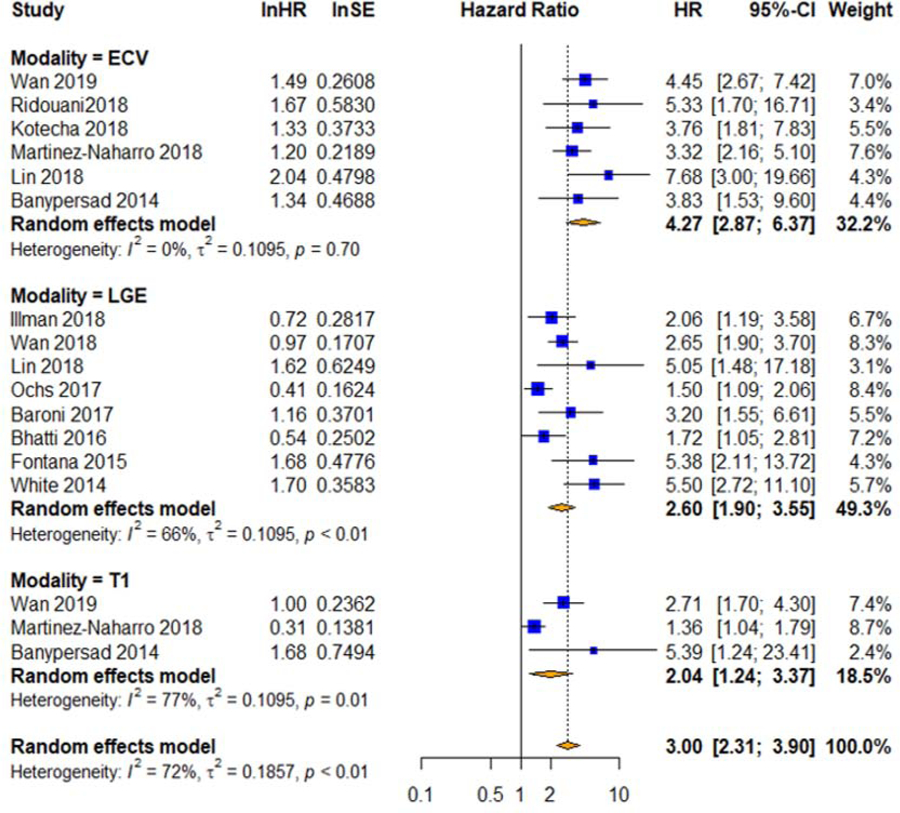
Pooled unadjusted hazard ratios for mortality with native T1 mapping, ECV, and LGE. CI=confidence interval, ECV=extracellular volume mapping, HR=hazard ratio, LGE=late gadolinium enhancement, ln=natural log, T1=native T1 mapping, SE=standard error of the hazard ratio.