
Central Illustration. Diagnostic and Prognostic Performance of LGE, Native T1, and ECV.
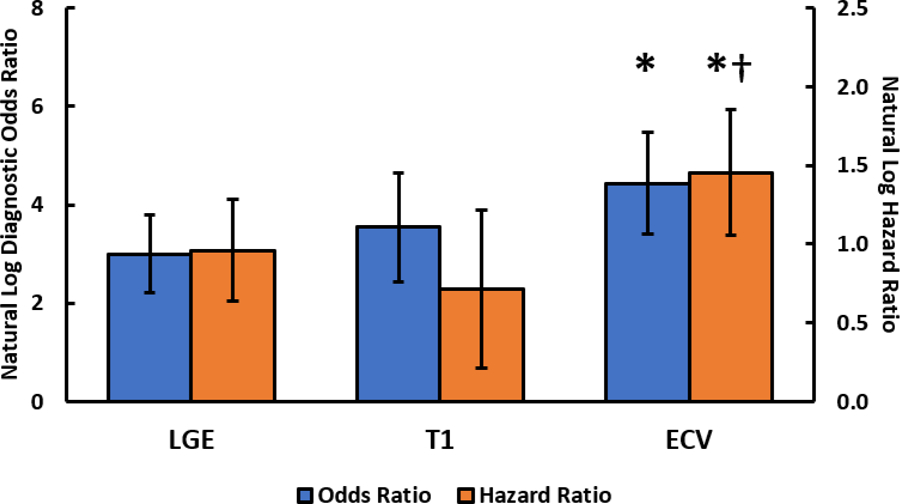
Natural log of the bivariate diagnostic odds ratio (blue) and unadjusted hazard ratio (orange) for LGE, native T1, and ECV. The whiskers represent the 95% confidence interval. The asterisk (*) indicates that ECV had a significantly higher diagnostic odds ratio (p = 0.03) and hazard ratio (p = 0.03) than that of LGE. The dagger (†) indicates that ECV had a significantly higher hazard ratio than that of native T1 (p = 0.01). ECV=extracellular volume mapping, LGE=late gadolinium enhancement, T1=native T1 mapping.