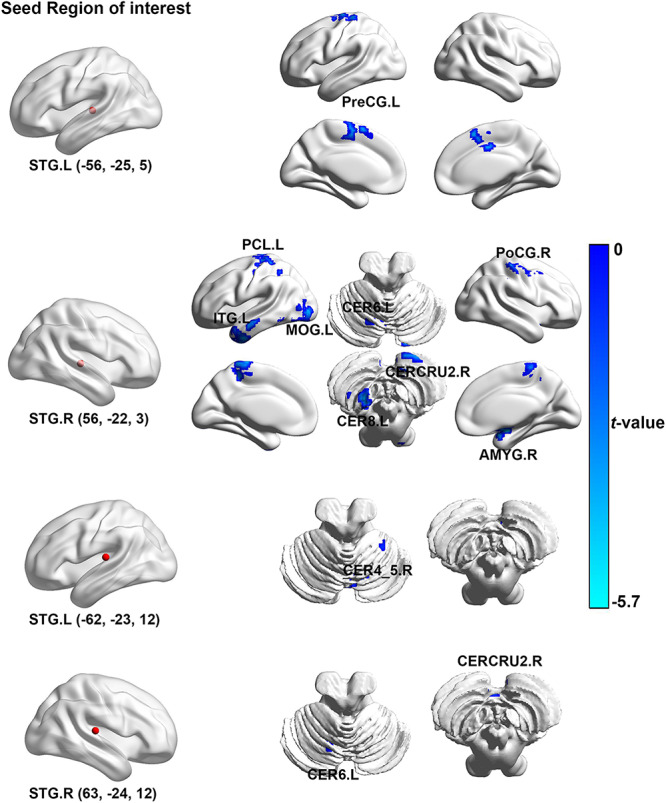
FIGURE 1.

The brain regions with significant difference in the auditory-FC between ISSNHL patients and healthy controls. Left brain diagram shows the seed region of interesting of auditory system, right brain diagram presents the regions with significant group-difference. FC, functional connectivity; STG, superior temporal gyrus; PoCG, postcentral gyrus; MOG, middle occipital gyrus; ITG, inferior temporal gyrus; PCL, paracentral lobule; AMYG, amygdala; CERCRU2, cerebellum_Crus2; CER4_5, cerebellum_4_5; CER6, cerebellum_6; CER8, cerebellum_8; L, left hemisphere; R, right hemisphere. The color bar represents the t-value.
