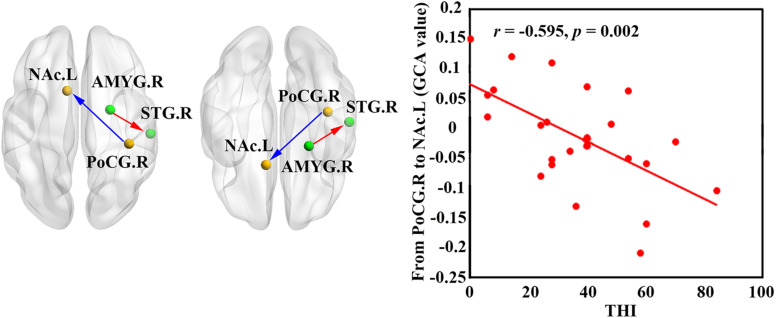
FIGURE 3.
Increased GCA value from AMYG.R to STG.R (in red) and decreased GCA value from PoCG.R to NAc.L (in blue) were found in the ISSNHL patients. The correlations between abnormal GCA value and THI in the ISSNHL patients. The red dots represent each ISSNHL patient. FC, functional connectivity; GCA, granger causality analysis; THI, tinnitus handicap inventory; STG, superior temporal gyrus; AMYG, amygdala; NAc, nucleus accumbens; PoCG, postcentral gyrus; left hemisphere; R, right hemisphere.

