
Figure 1. Microglia Mount a Heterogeneous Response to β-amyloid, Marked by Apoe Overexpression.
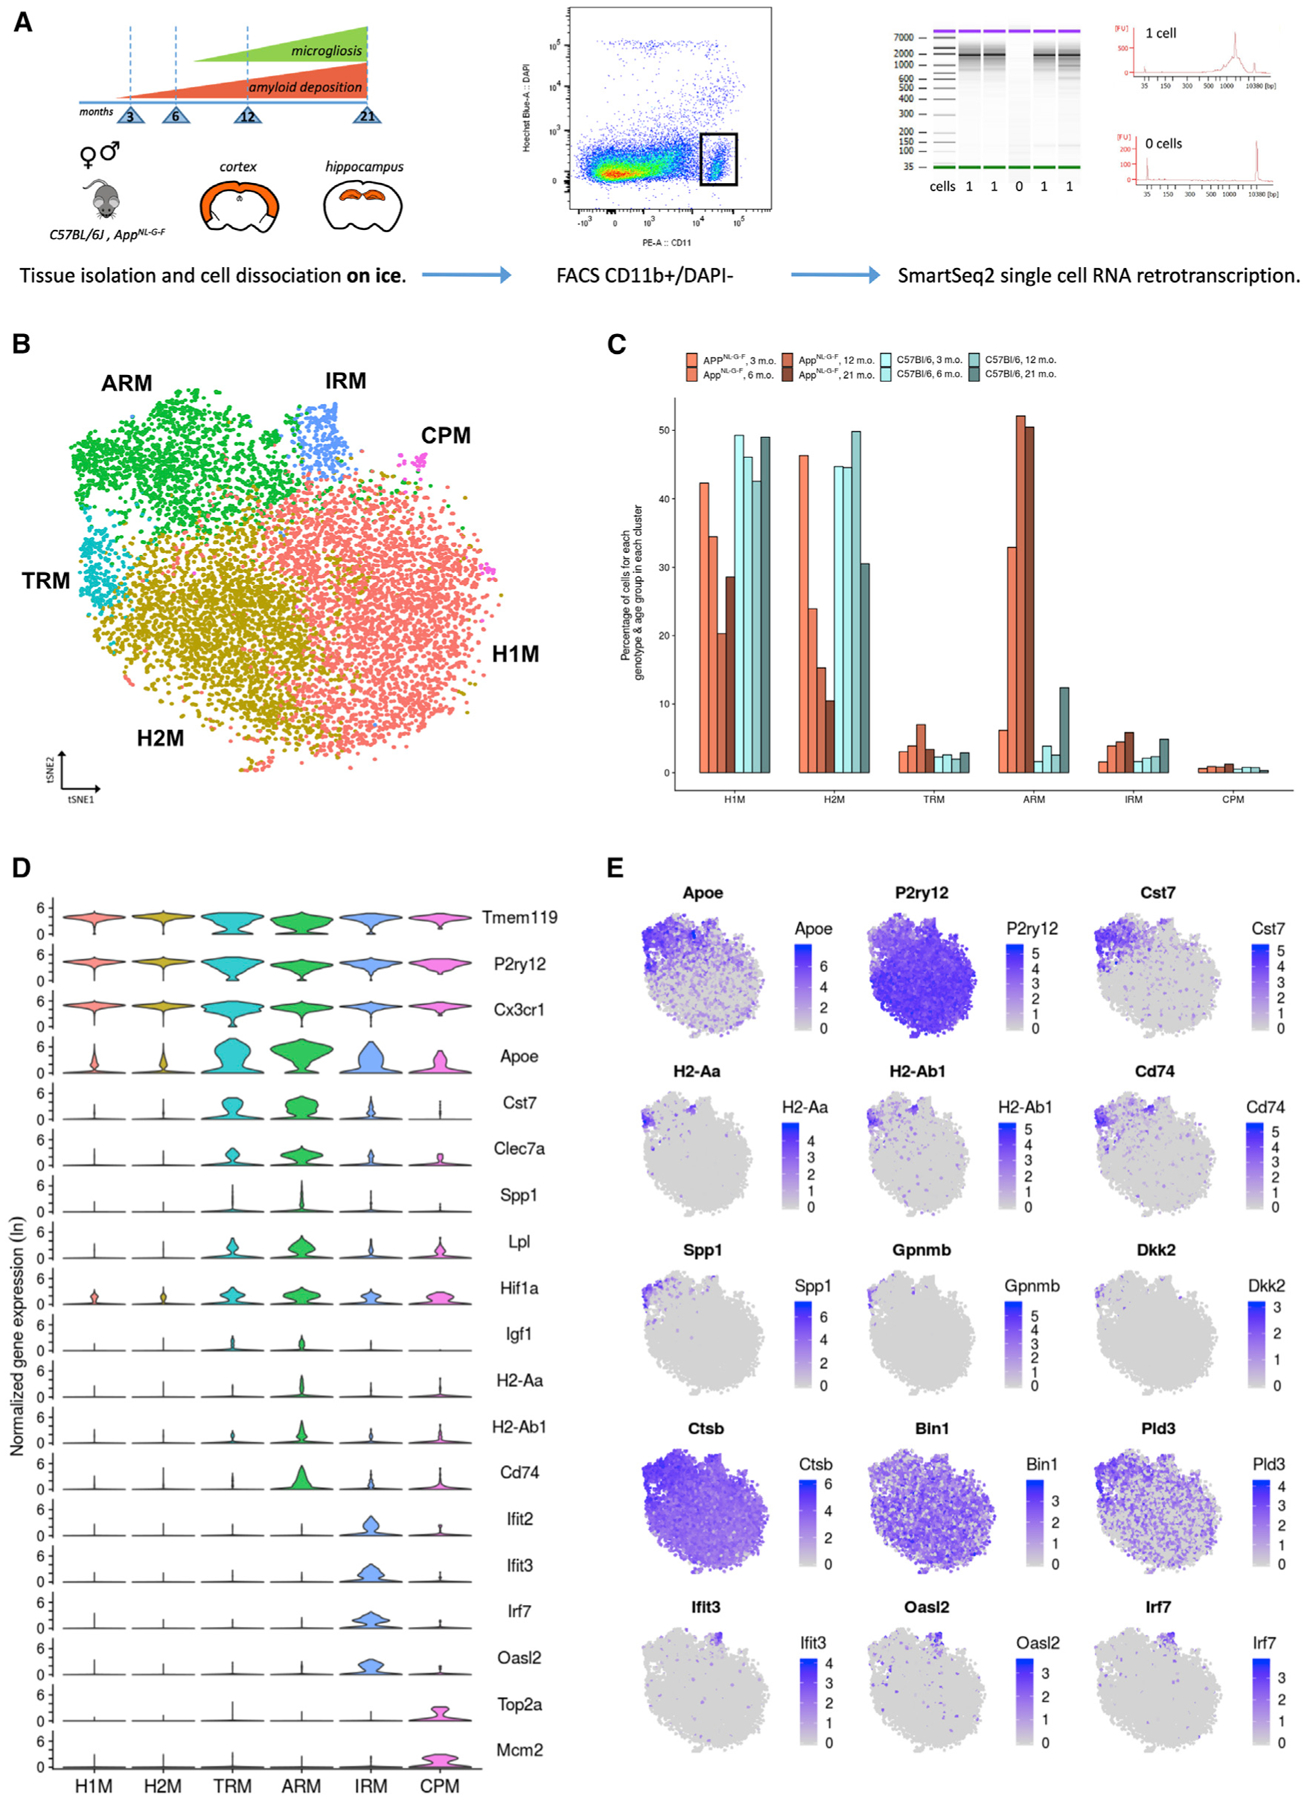
(A) Dataset presentation. We used male and female AppNL-G-F and wild-type C57BL/6J mice from four time points over the course of amyloid pathology and microgliosis as indicated. We dissected separately cortex and hippocampal tissues. The tissue from two animals for each experimental condition (age, sex, tissue, genotype) was pooled before microglia isolation. All procedures were performed on ice. Single live microglial cells were isolated by FACS (CD11b+, DAPI), and single-cell RNA-sequencing (RNA-seq) libraries were prepared according to the SmartSeq2 and Nextera methods.
(B) t-distributed stochastic neighbor embedding (t-SNE) plot visualizing the 10,801 single microglial cells passing quality control after removal of peripheral cells. Cells are colored according to clusters identified with Seurat’s k-nearest neighbors (kNN) approach (H1M and H2M, homeostatic microglia; TRM, transiting response microglia; ARM, activated response microglia; IRM, interferon response microglia; CPM, cycling and proliferating microglia).
(C) Percentage of cells from each genotype-age group for each cluster identified. AppNL-G-F cells are indicated in shades of red, while wild-type cells are indicated in shades of blue.
(D) Violin plots of selected marker genes for each identified cluster. The y axis indicates normalized gene expression (ln scale).
(E) t-SNE plots as in (B), colored by the level of ln normalized expression of selected genes. Clusters of TRMs and ARMs display increased expression of Apoe and inflammation markers (Cst7) and concurrently display a reduction of homeostatic markers (P2ry12). Two distinct regions of the ARMs cluster display increased expression of MHC class II genes (H2-Aa, H2-Ab1, and Cd74), suggesting the existence of microglial subpopulations. Further, a small subset of the ARMs cluster displays an enrichment for tissue repair genes (Spp1, Gpnmb, and Dkk2). The ARMs cluster also displays differential expression of several AD-related genes (e.g., Ctsb, Bin1, and Pld3) compared to clusters of H1Ms and H2Ms. The cluster of IRMs is enriched for interferon genes (Ifit3, Oasl2, and Irf7).
See also Figure S5.