
Figure 2. Microglia Diversify into Two Cell State Branches during Response to β-amyloid Plaques.
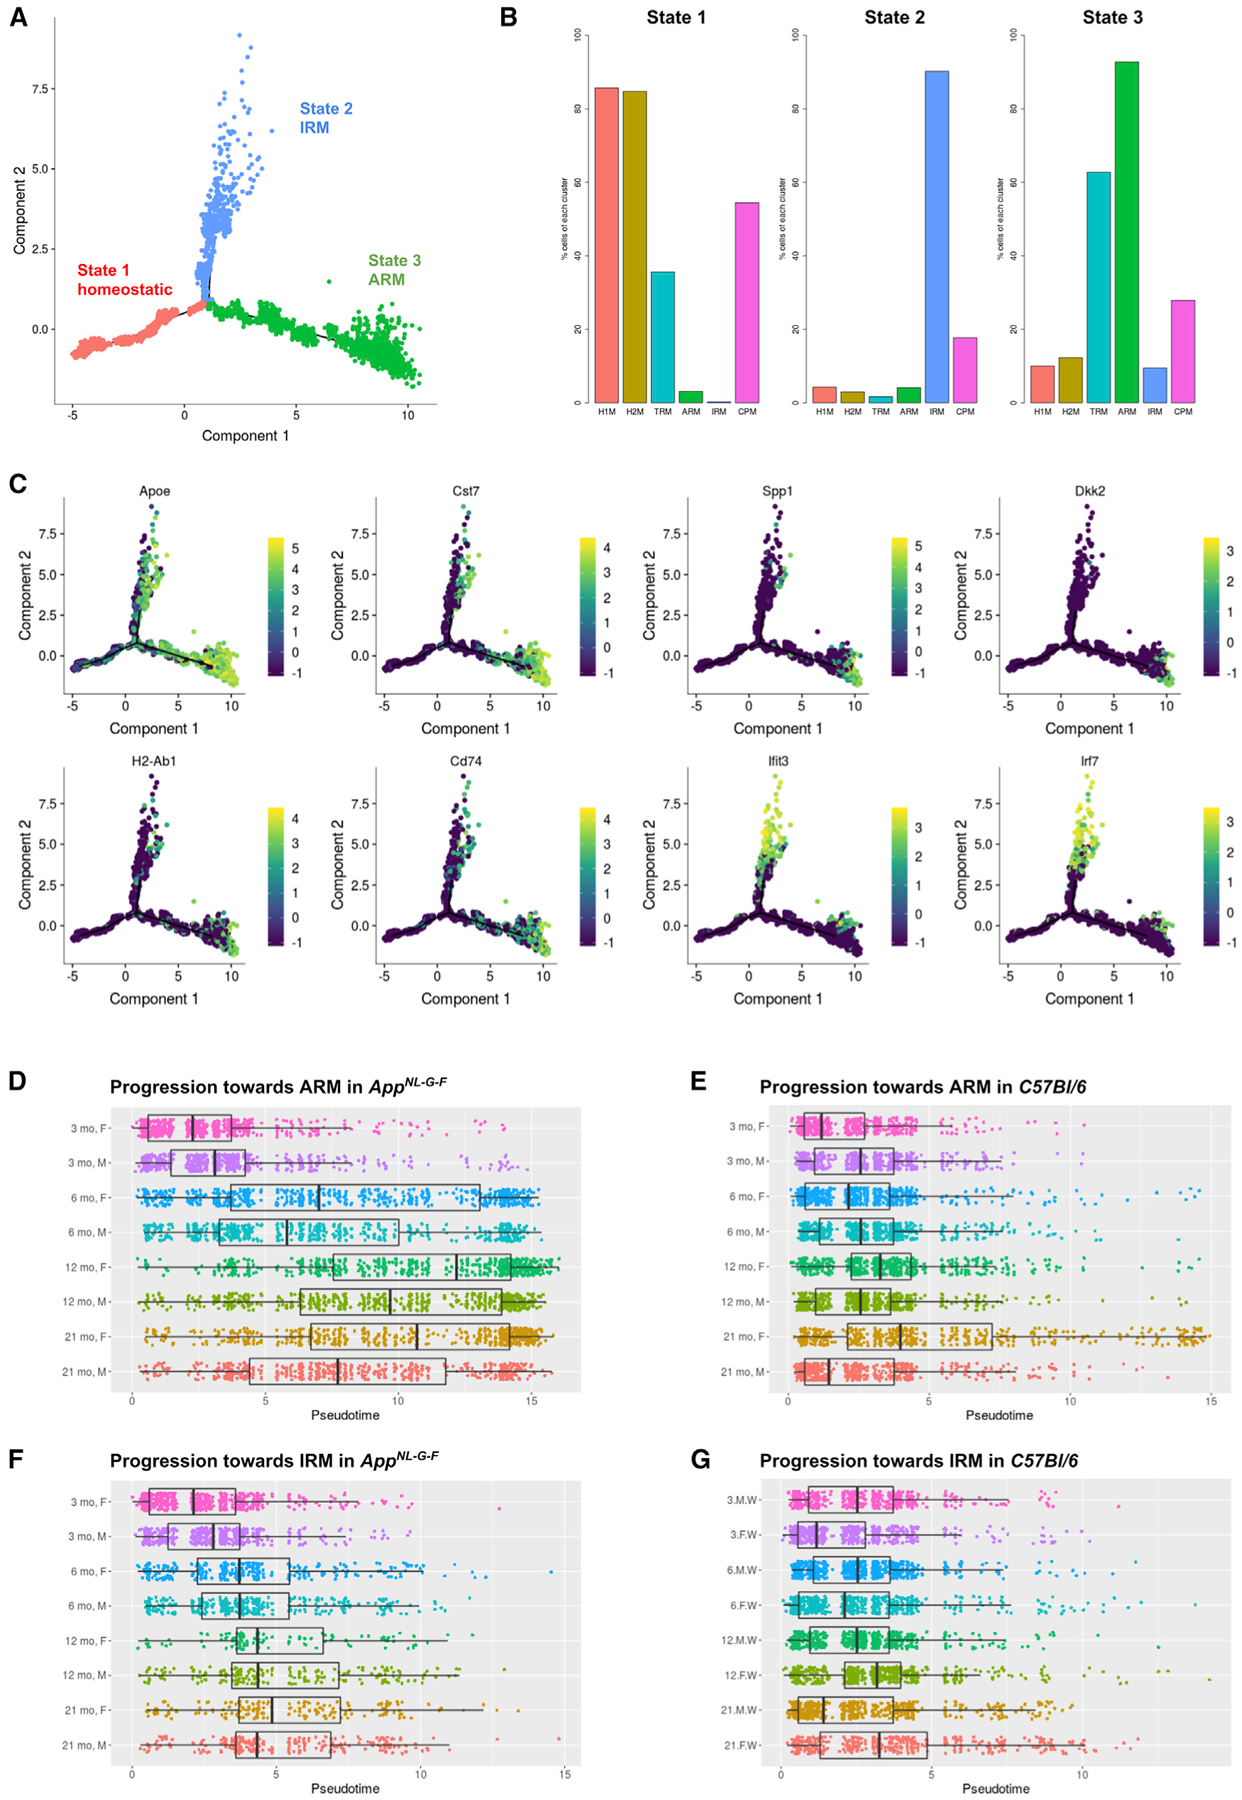
(A) Plot of cell trajectories for all microglial cells, obtained by a semi-supervised pseudotime ordering with Monocle 2. Microglia are grouped into three stages (red: stage 1; blue: stage 2; green: stage 3). Homeostatic microglia (red) progress toward two separate fates: either the multifunctional ARMs response (green) or the IRMs response (blue).
(B) Percentage of cells from each cluster (Figure 1B) per state. The majority (>80%) of homeostatic microglia (clusters of H1Ms and H2Ms) are in state 1, the majority of interferon response cells (cluster of IRMs) are in state 2, and the majority of the activated response cells (cluster of ARMs) are in state 3.
(C) Expression levels of selected marker genes are plotted over a plot of cell trajectories, as in (A).
(D) Pseudotime progression plot of homeostatic AppNL-G-F microglial cells to the ARMs branches, presented separately for each age-gender experimental condition. Box represents the interquantile range, and the thick bar represents the group median.
(E) Pseudotime progression plot from homeostatic to ARMs for each wild-type microglial cell.
(F) Pseudotime progression plot from homeostatic to IRMs response for each AppNL-G-F microglial cell.
(G) Pseudotime progression plot from homeostatic to IRMs response for each wild-type microglial cell.