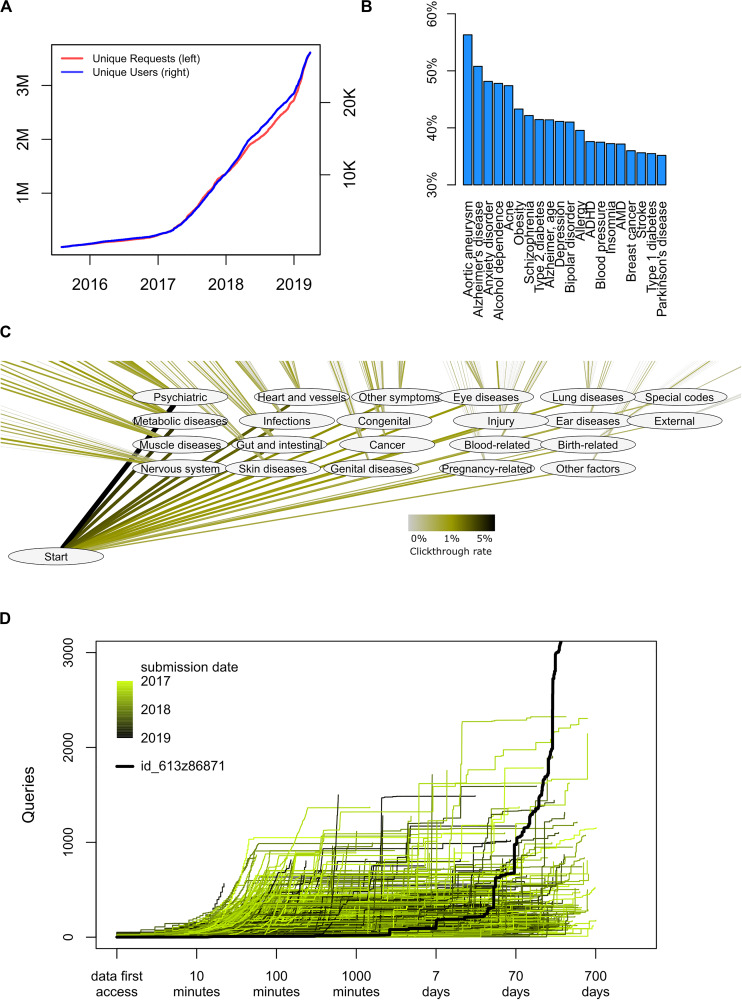
FIGURE 4.
Detailed usage statistics. (A) Overall count of unique users and unique analysis requests since August 2015. Each request corresponds to a specific analysis, for example, the risk score for a disease, or a view in the International Classification of Diseases, 10th Revision (ICD-10)-based map in the precision medicine module. Each user corresponds to an uploaded genome with a unique md5sum. There is no check for twins, altered files, or users with data from separate direct-to-consumer (DTC) companies. (B) Distribution of user interests in a trait in the complex disease module. In this module, each disease entry is presented on an alphabetically sorted list, with aortic aneurysm being the default value. The percentage indicates how many of the users scrolled down and selected this disease at least once (nclicks = 871,855). (C) Distribution of interests in a trait in the precision medicine module. In this module, each disease entry is presented in the layout of the ICD-10 classification system. The click-through rate reflects how many users pursued information in a given chapter or subchapter, as percentage of total amount of clicks (nclicks = 114,039). (D) Analysis of how individuals use the interface over time. For each user, the number of queries is shown as a function of time after they first access their data. As all data are automatically deleted after 2 years, no queries extend beyond 730 days. The color code indicates the submission date. The highlighted black line indicates the publically available permanent test user with ID id_613z86871, which is omitted from all other analyses.

