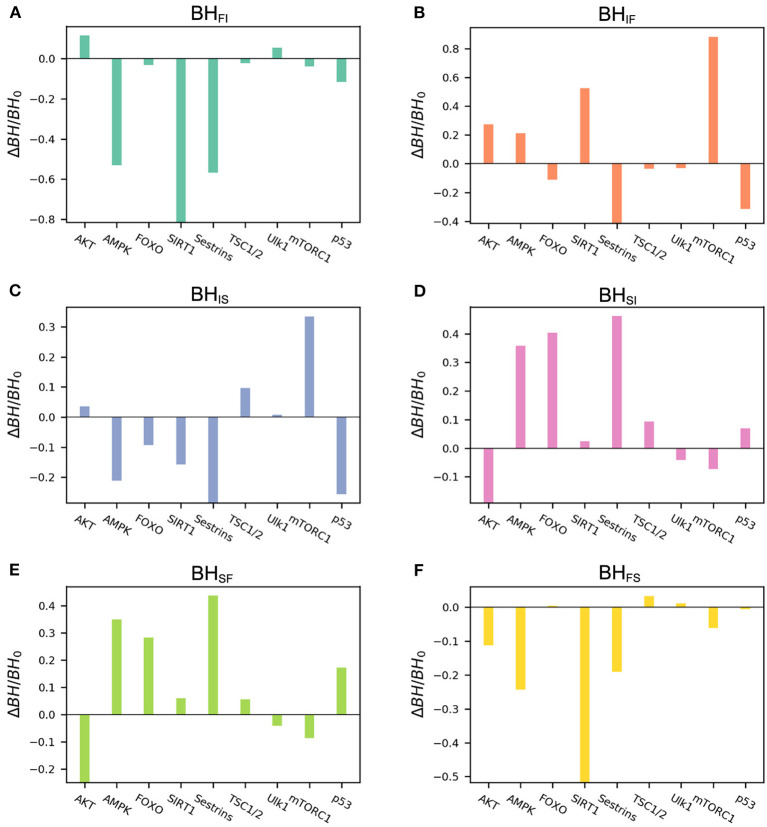
Figure 5.
Results of global sensitivity analysis of the barrier height upon changing the basal expression level of different genes. BH0, barrier height with the original value; ΔBH, change in barrier height upon changing the basal expression level. (A) Change in barrier height from the fast-aging to the intermediate attractor. (B) Change in barrier height from the intermediate to the fast-aging attractor. (C) Change in barrier height from the intermediate to the slow-aging attractor. (D) Change in barrier height from the slow-aging to the intermediate attractor. (E) Change in barrier height from the slow-aging to the fast-aging attractor. (F) Change in barrier height from the fast-aging to the slow-aging attractor.

