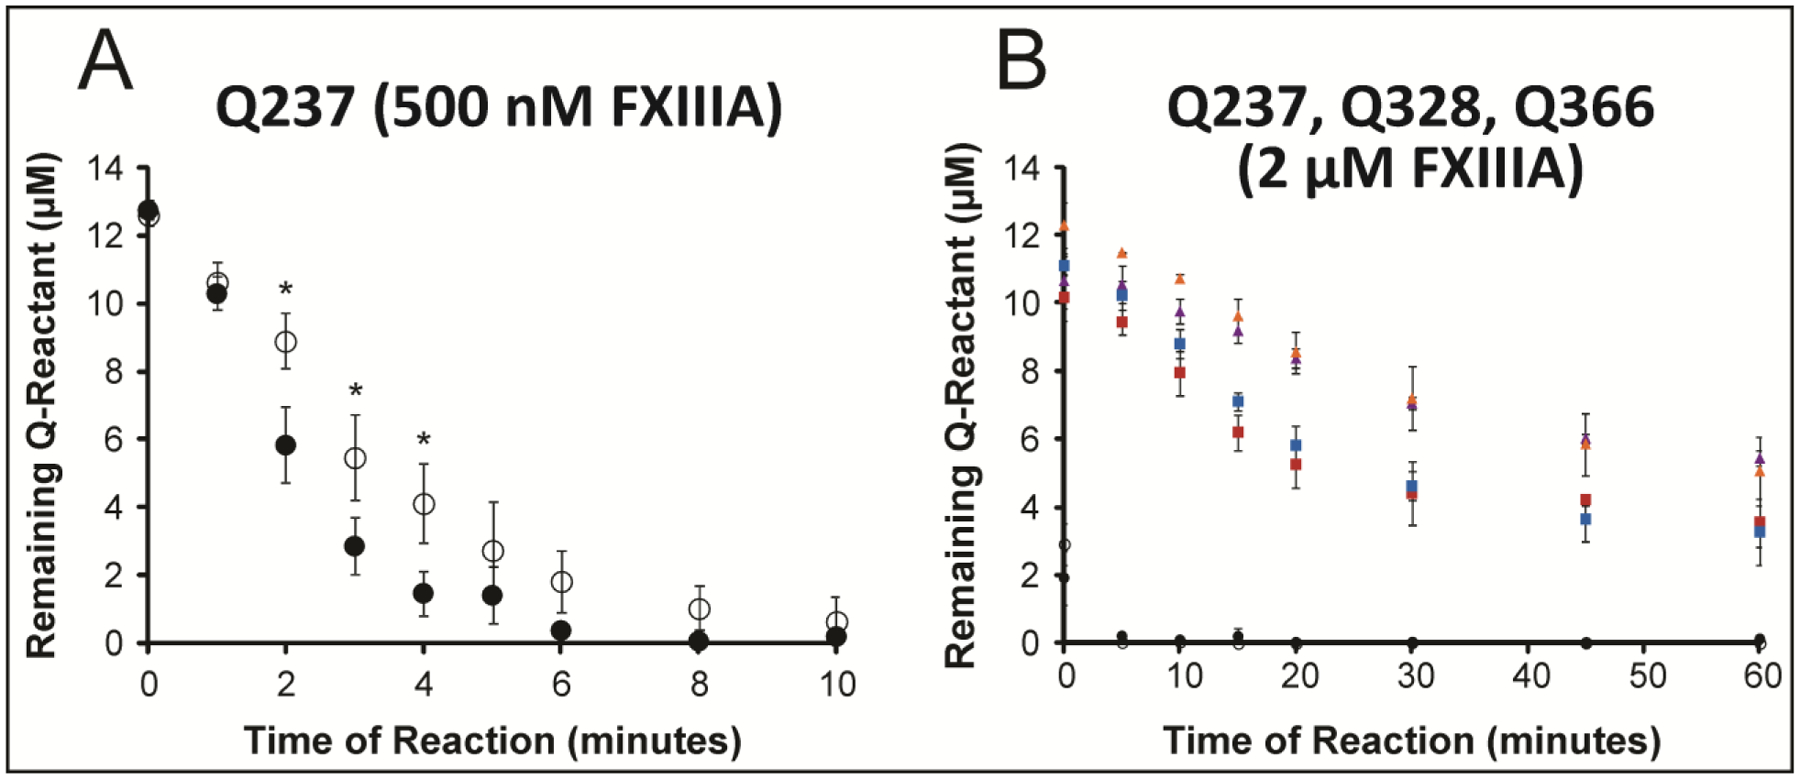
Figure 2: Comparing FXIII A2-catalyzed crosslinking of (Q237, Q328, and Q366) in WT Fbg αC (233–425) and the mutant αC E396A.

Two FXIIIa concentrations were employed in these trials. A) Reactivity of Q237 in WT Fbg αC (233–425) (black filled circles) versus the E396A mutant (black open circles) was monitored for 10 minutes in the presence of FXIII A2 (500 nM FXIIIA). For 2–4 minutes, the p-values were (0.008, 0.039, 0.128) and at 6 minutes the p-value was 0.059. B) Glutamine reactivities in WT Fbg αC (233–425) versus the E396A mutant were monitored for 60 minutes in the presence of 2 μM FXIIIA. The individual Q residues include Q328 WT (purple triangle), Q328 E396A (golden triangle), Q366 WT (red square), Q366 E396A (blue square), Q237 WT (black filled circle), Q237 E396A (black open circle). For A) and B), the peak-height ratio method was employed to calculate the amount of Q reactant left following reactions with GEE. Experiments were performed in triplicate, and the results reported as mean ± SD. Asterisk (*) for p-values less than 0.05.
