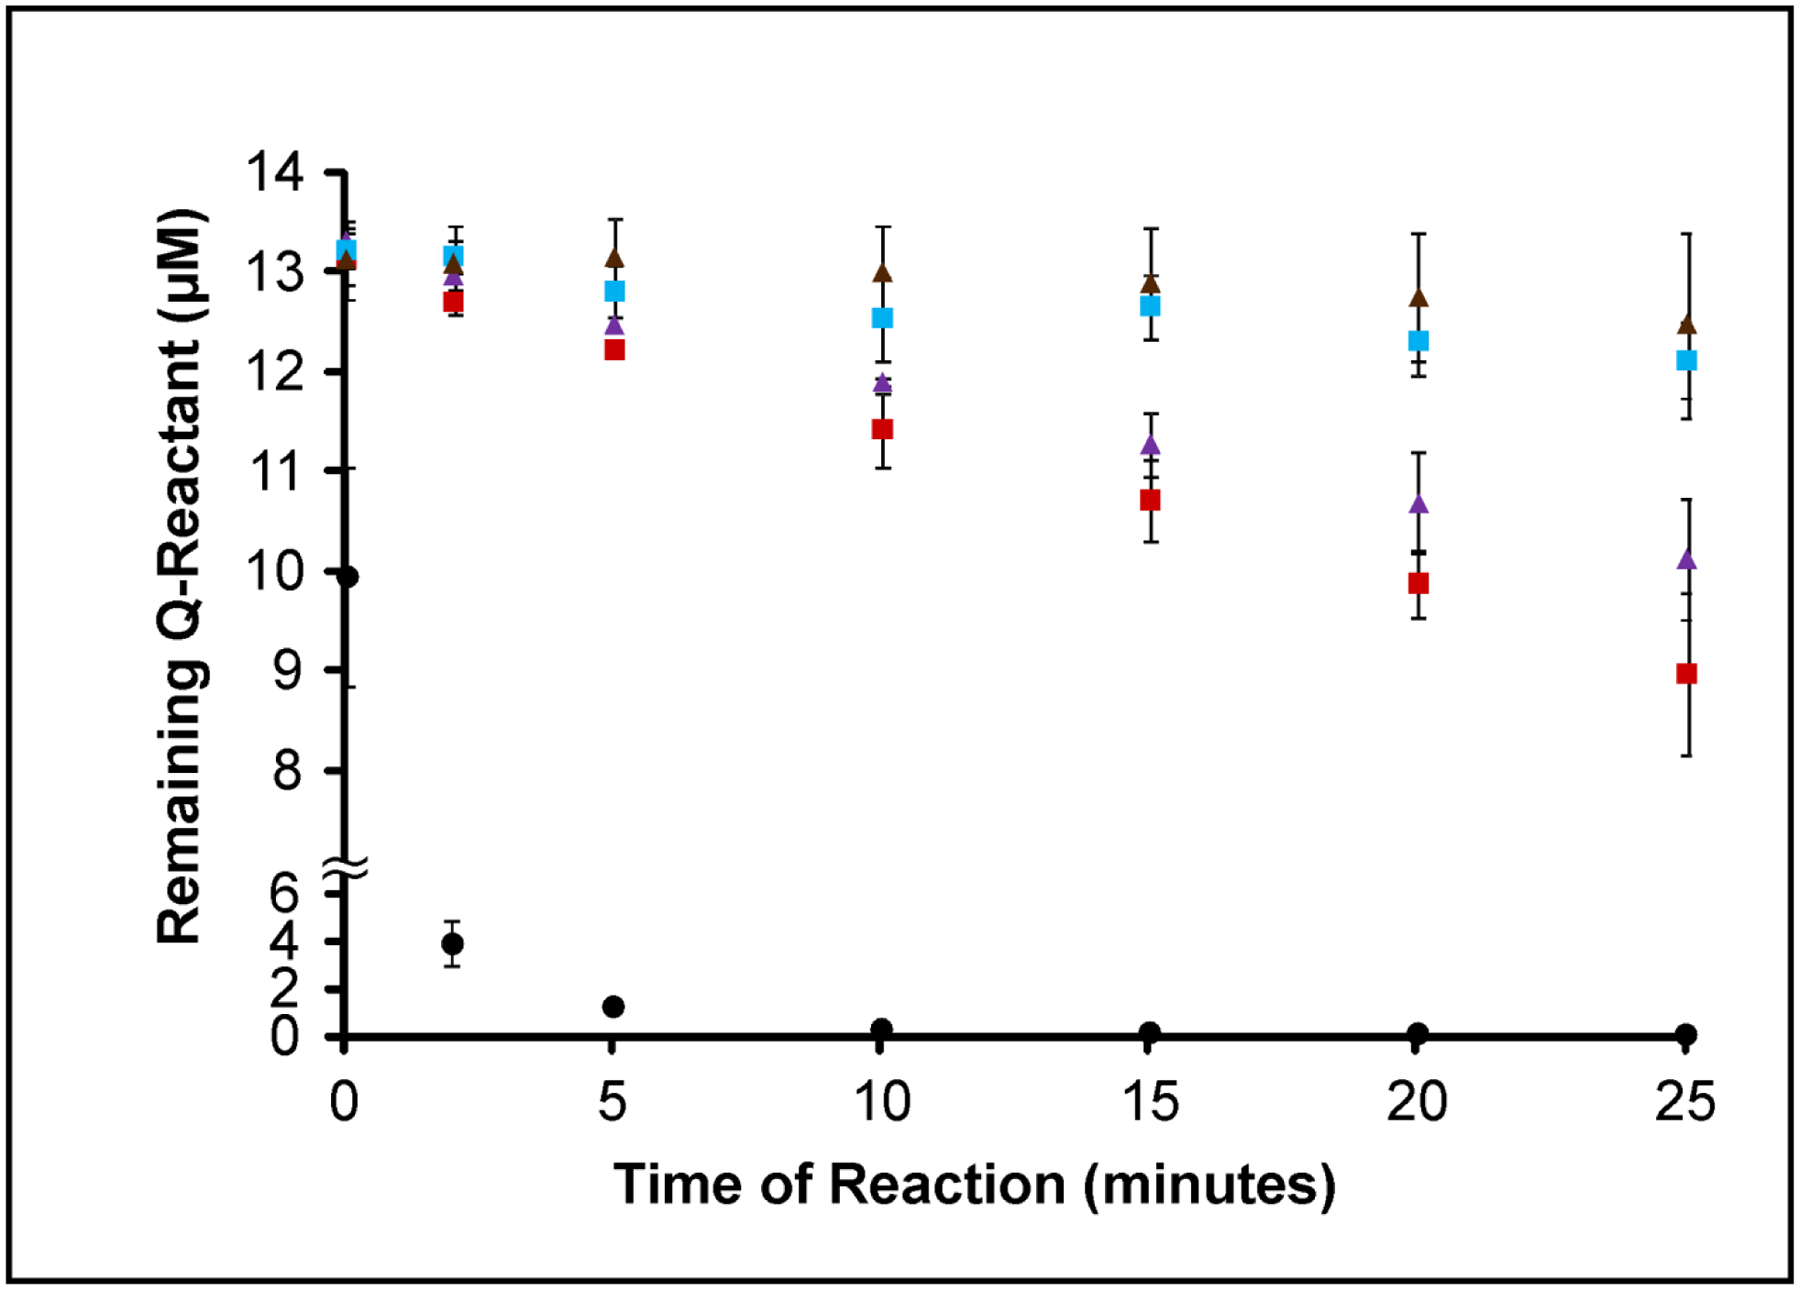
Figure 5: Plot comparing FXIII A2-catalyzed crosslinking of three reactive Qs in WT Fbg αC (233–425) versus αC Q237N.

Glutamines reactivities in WT Fbg αC (233–425) versus the Q237N mutant were monitored for 25 minutes in the presence of 500 nM FXIIIA (pre-activated FXIII A2). The individual Q residues include Q328 WT (purple triangle), Q328 within Q237N (brown triangle), Q366 WT (red square), Q366 within Q237N (blue square), and Q237 WT (black circle). The peak-height ratio method was used to calculate the amount of Q reactant left following reactions with GEE. Experiments were performed in triplicate and the results reported as mean ± SD
