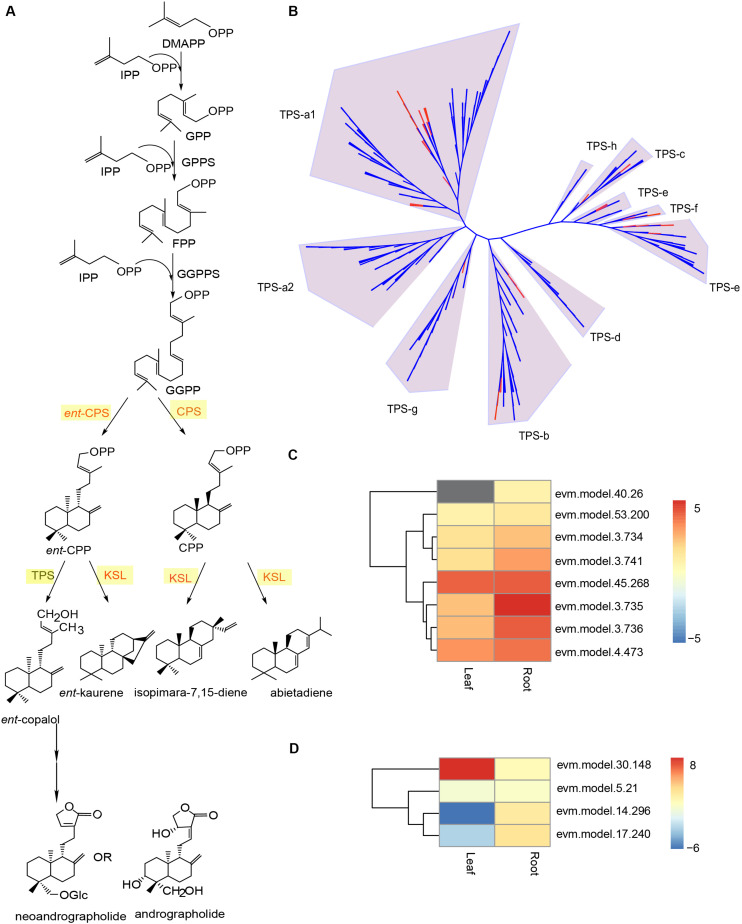
FIGURE 6.
Genomic analysis of putative TPS genes in the A. paniculata genome. (A) Schematic biosynthetic pathway of andrographolide and neoandrographolide. (B) Phylogenetic analysis of TPS genes in A. paniculata and other plants. Red branches indicate putative TPS genes in A. paniculata. (C) Expression levels of putative KS/KSL genes in the leaf and root tissue of A. paniculata. (D) Expression levels of putative CPS genes in the leaf and root tissue of A. paniculata.

