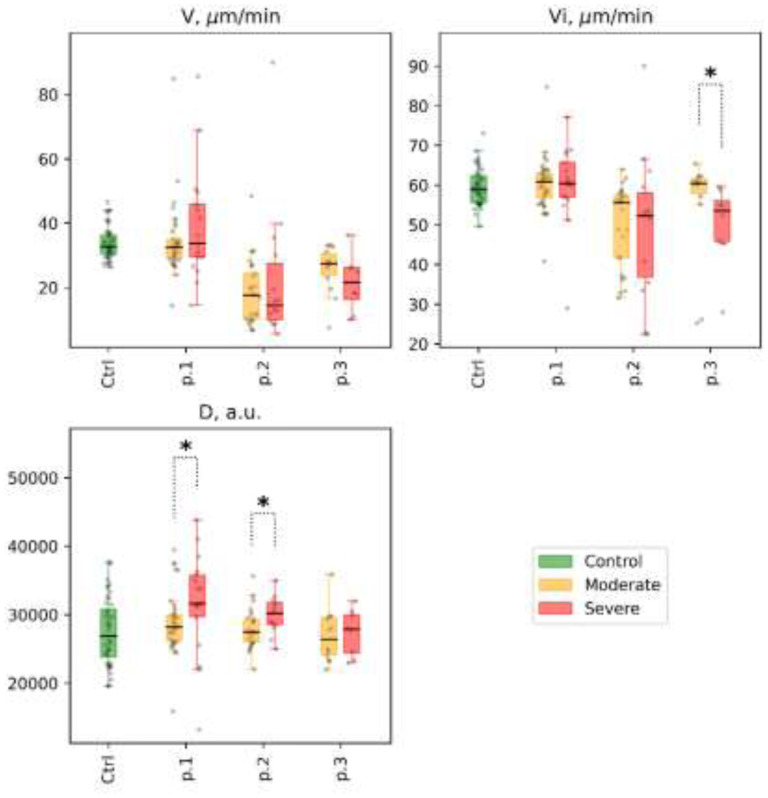
Figure 6.
Thrombodynamics. Selected parameters are shown for different patient subgroups at time points 1, 2, and 3 (labeled as p.1, p.2, and p.3, respectively), at the x-axis: clot growth rate (V), μm/min; initial clot growth rate (Vi), μm/min; clot density (D), arb units). Distribution of values in the control group is shown for reference (labeled as Ctrl at the x-axis, for each parameter). Mann-Whitney p-value are shown for comparisons of distributions between moderate and severe groups at different time points: * p-value<0.05, q-value>0.1; ** p-value<0.05, q-value<0.1

