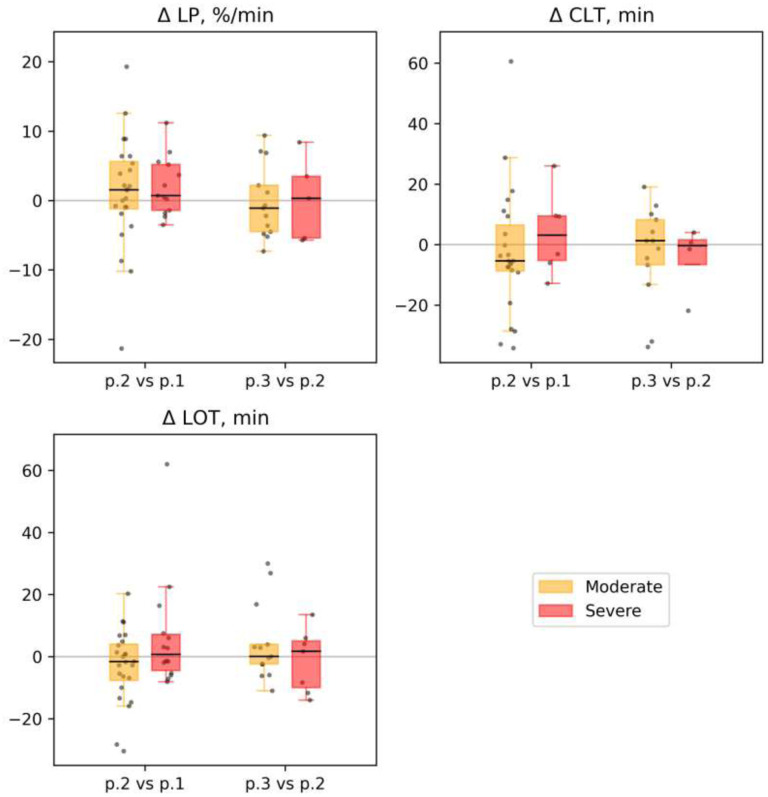
Figure 9.
Fibrinolysis. The dynamics of selected parameters for different groups of patients at time points 1, 2, and 3 (labeled as p.1, p.2 and, p.3 at the x-axis, for each parameter): Lysis progression (LP), %/min; clot lysis time (CLT), min; lysis onset time (LOT), min. Each patient’s individual changes in parameter levels at different time points were used as a basis for box-and-whiskers plot. Points of comparison are labeled at the x-axis as ‘p.2 vs. p.1’ for differences between point 2 and point 1 and as ‘p.3 vs. p.2’ for differences between point 3 and point 2. The Wilcoxon signed-rank test p-values for comparison between time points are shown: * p-value<0.05, q-value>0.1; ** p-value<0.05, q-value<0.1.

