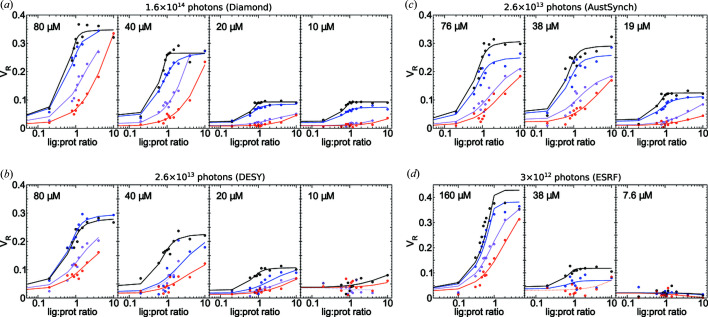
Figure 4.
Replicate V R titration curves of HisBP against four ligands: His (black), Arg (blue), Lys (violet) and Orn (red). Data collected at various total doses: (a) 1.6 × 10¹⁴ photons at Diamond, N = 192; (b) 2.6 × 10¹³ photons at DESY, N = 172; (c) 2.6 × 10¹³ photons at Australian Synchrotron, N = 144; and (d) 3 × 10¹² photons at ESRF, N = 144. The HisBP concentrations used within each experiment are labelled on respective plots. Note that the maximum q-range measured in (d) was 2.8 nm−1, which affected the V R.

