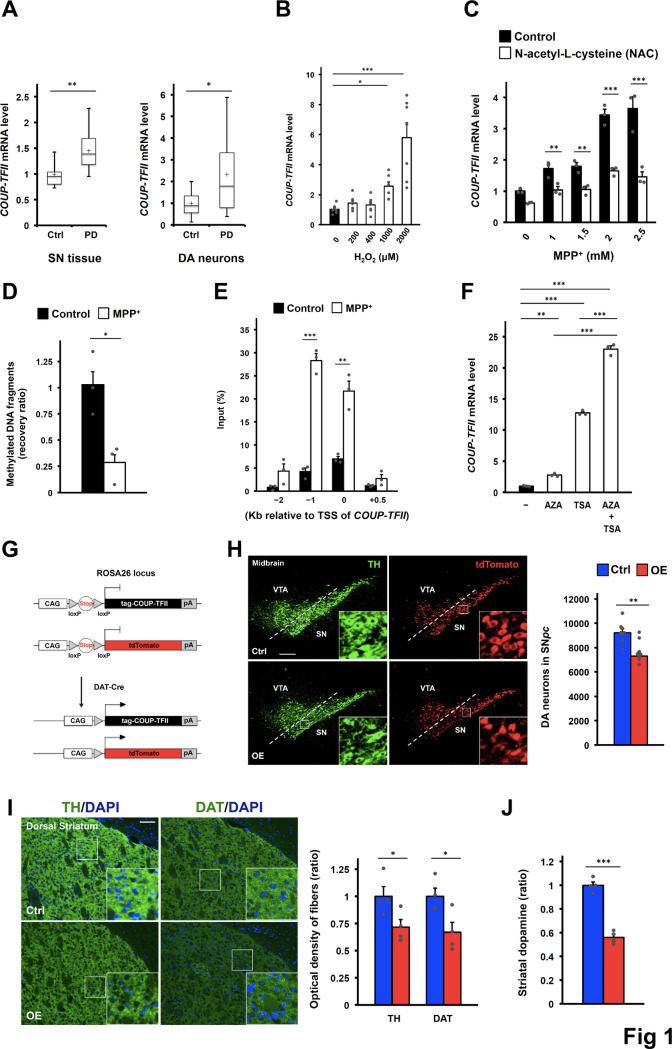
Fig 1. Elevated COUP-TFII expression in DA neurons causes mild degeneration in mice.
(A) COUP-TFII mRNA levels in the substantia nigra (SN) tissues (left) of healthy controls (n = 9) and sporadic PD patients (n = 16) from GSE7621 and in DA neurons (right) of the SN tissues from healthy controls (n = 8) and sporadic PD patients (n = 10) from GSE20141. (B) COUP-TFII mRNA levels in the differentiated SH-SY5Y cell line after 24-hour H2O2 treatment. n = 7/group from repeated independent experiments. One-way ANOVA Fisher’s LSD post hoc test. (C) COUP-TFII mRNA levels in the differentiated SH-SY5Y cell line after 24-hour neurotoxin MPP+ treatment in the absence or presence of 2 mM N-acetyl-L-cytsteine (NAC) antioxidant. n = 3 replicates/group. Two-way ANOVA Fisher’s LSD post hoc test. This experiment was independently repeated and produced with similar results. (D) Relative recovery ratio of methylated DNA fragments from the gene locus of COUP-TFII in the differentiated SH-SY5Y cell line after 24-hour neurotoxin MPP+ (1mM) treatment. n = 3/group. (E) ChIP-qPCR results of histone H3 acetylation at the gene locus of COUP-TFII in the differentiated SH-SY5Y cell line after 24-hour neurotoxin MPP+ (1mM) treatment. TSS, transcription start site. n = 3/group. (F) COUP-TFII mRNA levels in the differentiated SH-SY5Y cell line after 4-day DNA methyltransferase inhibitor (1 μM, AZA) and/or 1-day histone deacetylase inhibitor (0.5 μM, TSA) treatment. AZA, 5-aza-2'-deoxycytidine; TSA, Trichostatin A. n = 3/group. Two-way ANOVA Fisher’s LSD post hoc test. (G) Strategy to overexpress COUP-TFII in DA neurons in mice. DAT-Cre, Cre recombinase expression under the control of the endogenous dopamine transporter (DAT) gene; tag, MYC-Tag; CAG, CAG promoter; pA, poly(A) signals. (H) Representative images (left) and quantification (right) of DA neurons in the ventral midbrain of 16- to 17-week-old control (Ctrl) and COUP-TFII overexpression (OE) mice after staining with anti-tyrosine hydroxylase (TH) or anti-tdTomato antibodies (higher-power views in the insets). n = 8/group. Scale bar, 200 μm. (I) Representative images (left) and quantification (right) of DA axonal projections to the dorsal striatum of 16- to 17-week-old mice after staining with anti-TH or anti-DAT antibodies (higher-power views in the insets). n = 4/group. Scale bar, 100 μm. (J) Relative total striatal dopamine of 16- to 17-week-old mice. n = 4/group. (A-J) *p < 0.05; **p < 0.01; ***p < 0.001 compared to control (t-test if not indicated). Mean ± SEM. See also S1 Fig.

