
Figure 1.
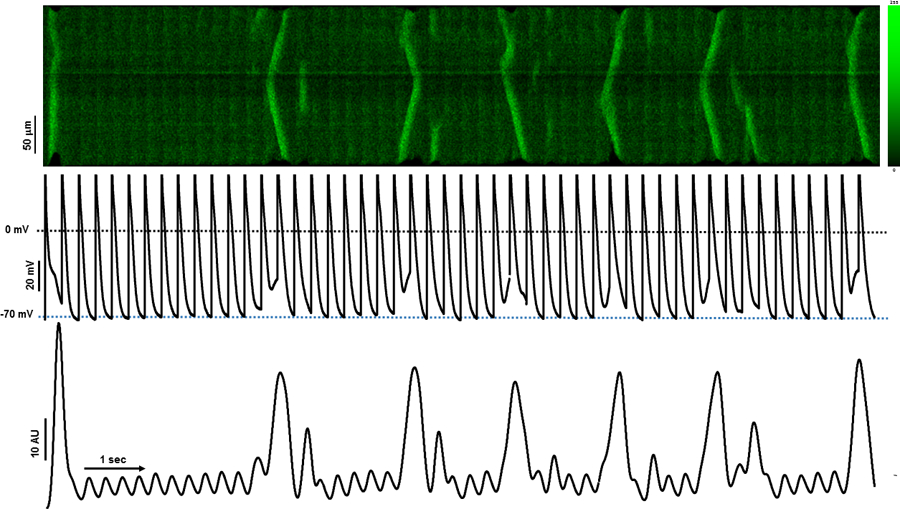
Effects of triggered calcium waves on membrane potential (Vm). The image shows a confocal Xt-linescan recording (top) with simultaneous voltage Vm (middle trace) and mean F vs time profile (Ft, bottom trace) of a dog left atrial myocyte paced at BCL=300ms. Fluorescence intensity scale is presented in arbitrary fluorescence units.