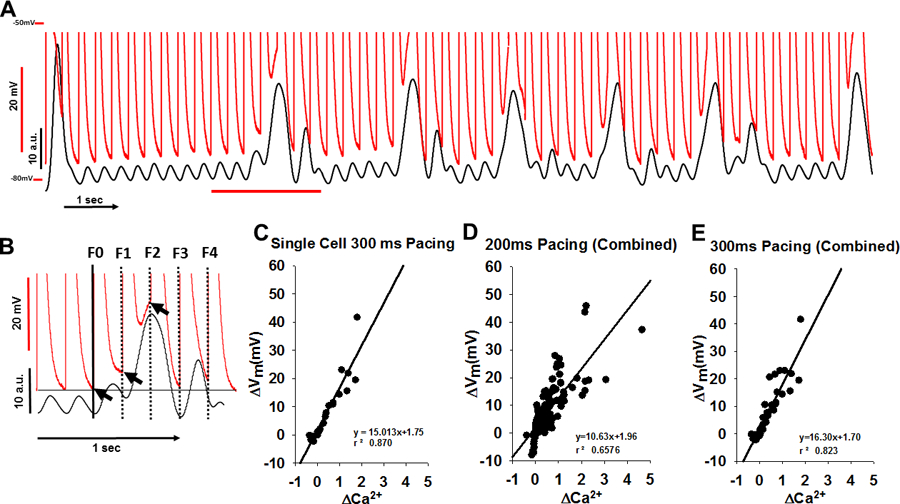
Figure 2.

The ΔVm-ΔCa2+ relationship during triggered Ca2+ waves (TCWs). A. The superposition (top) of Vm and fluorescence from Figure 1 during rapid pacing. B. Method for measuring Vm and Ca2+: the mean fluorescence and corresponding voltage changes were measured immediately prior to the stimulus and compared to Vm immediately prior to beginning of a TCW (from expanded section in red from A). The horizontal black line indicates MDP in the absence of a wave. Arrows indicate Vm at which MDP was measured. C. Relationship between TCW magnitude and the magnitude of depolarization. D-E. Summary data from 7 myocytes (3 dogs) at 200ms pacing (D) and 5 myocytes (3 dogs) at 300 ms pacing (E).
