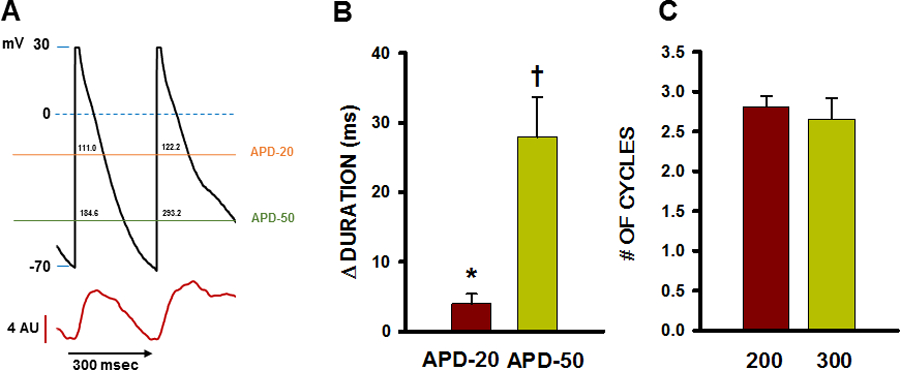
Figure 3.

Relationship between TCWs and change in APD and number of cycles affected by TCWs. A. Representative recording of APD prolongation during a TCW showing how APD at −20mV (APD-20) and APD at −50mV (APD-50) were measured. Values in milliseconds are indicated above each horizontal line within the AP waveform at APD-20 and APD-50. B. Summarized changes in APD during TCWs (CL = 300 msec). n = 25 waves in 12 myocytes from 6 dogs. * p<0.02; † p<0.001 as determined by t-test. C. Summary of number of consecutive APs affected by each TCW at BCL= 200 and 300 msec. n = 29–43 myocytes in 4–6 dogs for each condition. NS as determined by t-test.
