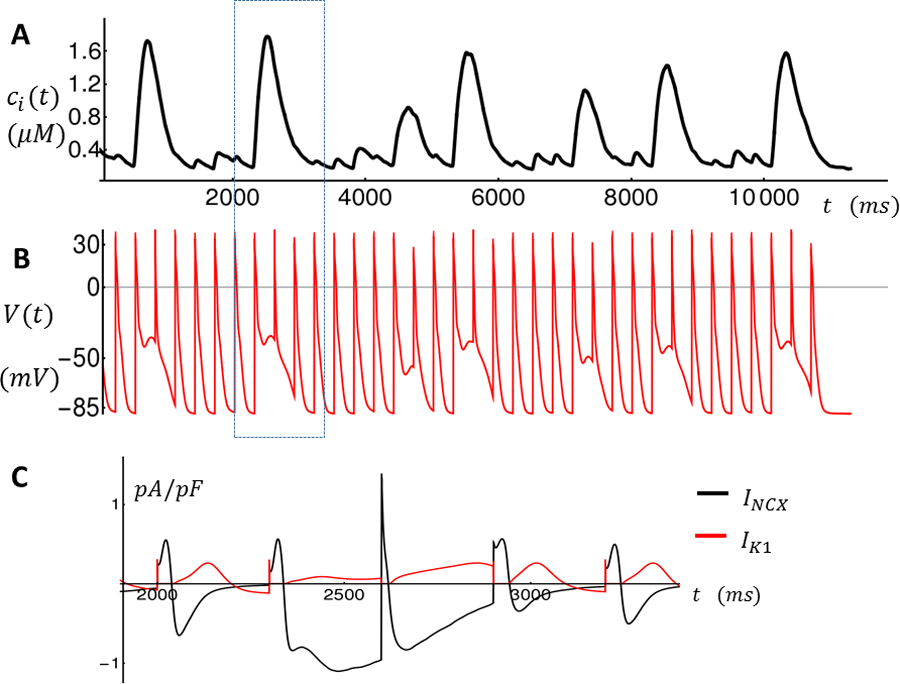
Figure 5.

Intracellular Ca2+ concentration and membrane voltage as a function of time during rapid pacing. A. Average cytosolic Ca2+ concentration Ci is shown for the last 36 beats. Large Ca2+ releases indicate TCWs. B. Membrane voltage V (t) as a function of time. C. Time course of Ik1 and INCX for the time interval enclosed by the dashed rectangle indicated in A-B.
