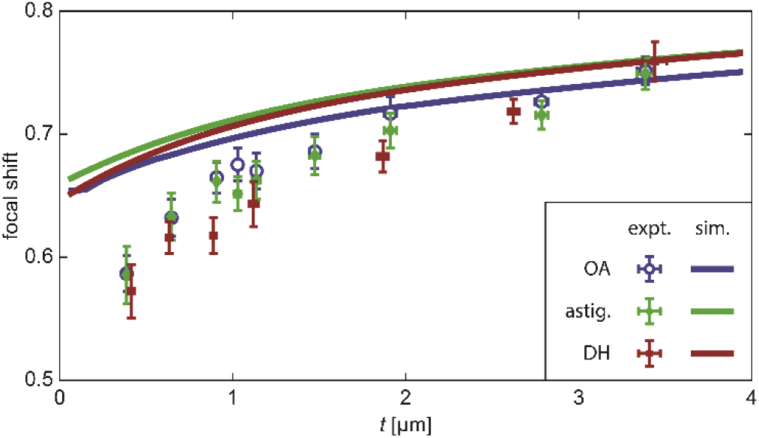
Fig. 5.
Depth-dependence of focal shift for emitter at z above the coverslip. Data points are measured using samples of polymer thickness corresponding to the axial position. Error bars indicate standard deviation (Appendix E). Solid curves show simulated focal shift based on a phase-retrieved PSF. Colors indicate OA (blue), astigmatic (green), or DH (red) PSFs.

