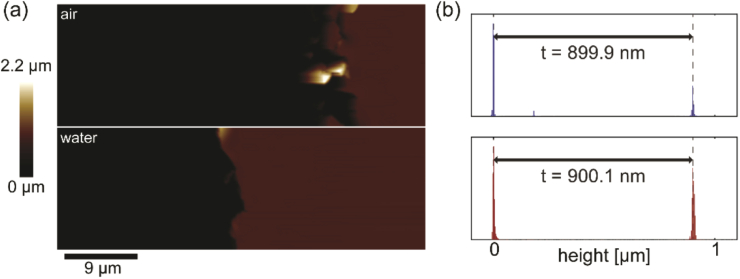
Fig. 9.
Atomic force microscopy. (a) Micrographs in the same region of a polymer sample (dark red area), near a cut made with a scalpel (black area). Following the scan in air (top), the sample was immersed in water for ∼2 hrs before acquisition of a scan in water (bottom). (b) Histograms of measured heights show peak separations are unchanged by the addition of water to the top of the sample.

