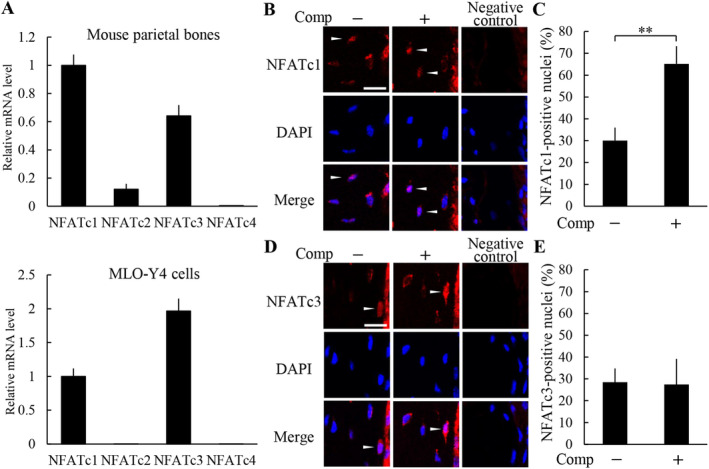
Figure 5.

Compressive force induced nuclear translocation of NFATc1 in osteocytes. (A) NFATs mRNA expression level in mouse parietal bones and MLO‐Y4 cells was analyzed by real‐time PCR (n = 3). Nuclear translocation of NFATc1 (B,C) and NFATc3 (D,E) in the parietal bones of the nonloaded and loaded groups was analyzed by immunohistochemistry (B,D), and the ratio of positive nuclei in osteocytes (C,E) was calculated (four animals per group). Arrowheads indicate the nuclear translocation of NFAT in osteocytes. Scale bar = 10 μm. Comp = compressive force loading. **P < 0.01.
