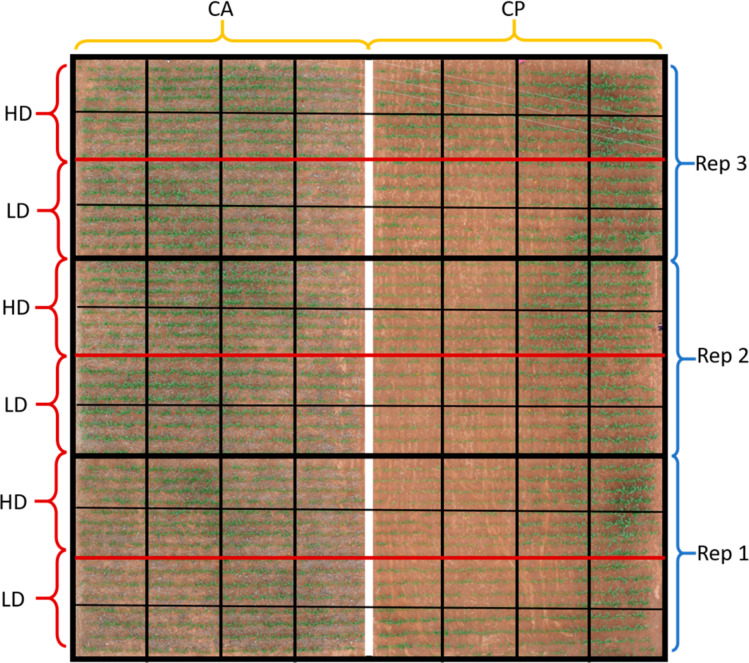
Figure 2.
Map of the experimental design showing alternating High Density (HD) and Low Density (LD) plots per replicate, with Conservation Agriculture (CA) on the left and Conventional Ploughing (CP) on the right. Each square corresponds one plot dedicated to each of the different hybrids used. Complete details of the experimental design are explained in Section 2.2.

