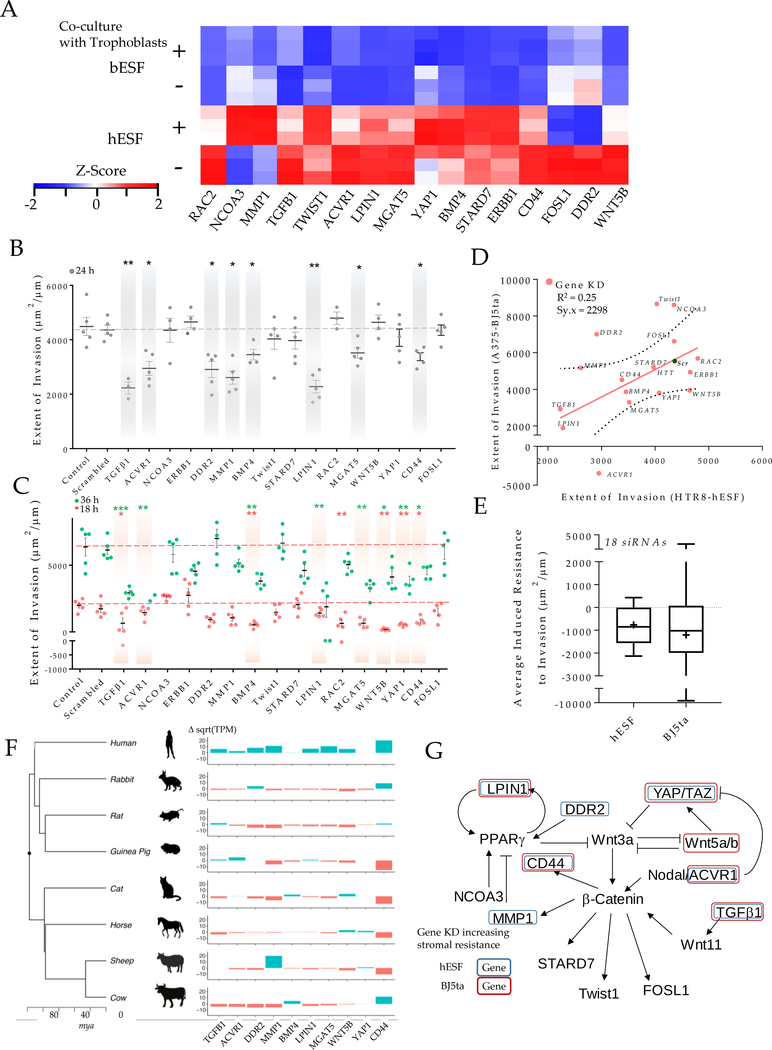
Figure 4. Induced resistance to invasion in human stroma by evolutionarily inspired gene silencing.
(A) Heatmap showing selected set of genes used for gene silencing in human stromal fibroblasts; Shown are z-score of TPM values for each transcript. (B-E) siRNA based gene knockdown in human stroma to induce expression similar to bESF increases resistance to invasion; (B) Extent of invasion of HTR8 cells into hESFs subjected to siRNA mediated gene silencing measured over 24 hours using nanotextured platform; (C) Extent of invasion measured for 18 hours (red), and 36 hours (green) using nanotextured platform for A375 invasion into BJ5ta subjected to siRNA induced silencing of individual genes; Each dot in B, C reflects an individual invasion observation, Error bars show s.e.m., Statistical comparisons made with scrambled siRNA using Student-t-test; *: P < 0.05, **: P < 0.01, ***: P < .0001. (D) Correlation shown between the extent of invasion of HTR8 into hESF, and A375 into BJ5ta for each siRNA based gene silencing; (E) Average extent of invasion in hESF and BJ5ta for the above 20 gene silencing normalized to the extent of invasion observed for control scrambled siRNA knockdown in either human stromal cells; Whiskers show min to max values; horizonal bar is the median; average values are indicated by +, box is 25 to 75 percentile. (F) Relative transcript levels of the selected genes in various boroeutherians species compared to their most common ancestor; red colored bars denote decrease, and green bars show difference in sqrt(TPM) values vs the common ancestor; mya refers to million years ago. (G) Network of WNT signaling and its interaction with TGFB pathway showing previously known interactions, mapped with the gene silencing induced resistance in hESF, and BJ5ta stromal cells.

