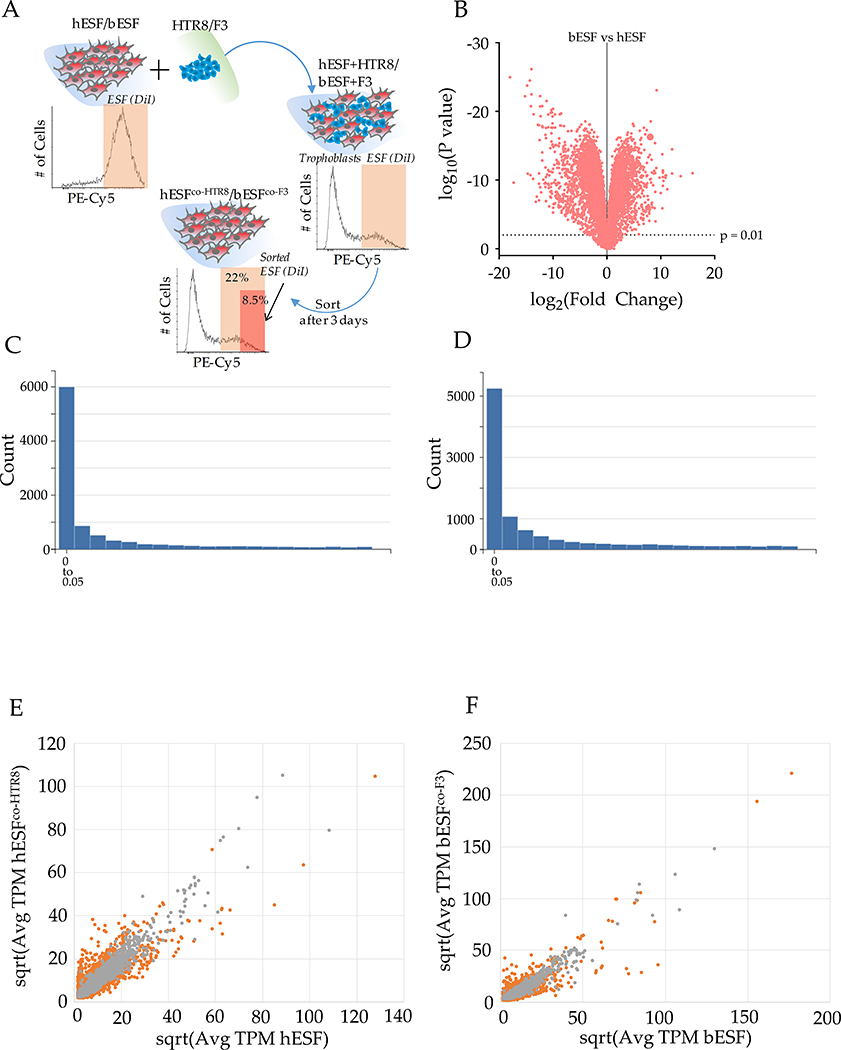
Extended Data Figure 3. Human and bovine endometrial stromal fibroblasts respond differently to co-culture with trophoblasts.
(A) Experimental plan to isolate endometrial cells after co-culture with respective trophoblast; (B) Volcano plot showing fold change in genes between bovine vs human endometrial stromal fibroblasts, along with their significance depicted in p value. (C) P-value distribution of t-tests comparing human ESFs with and without co-culture with HTR8 trophoblast cells. (D) P-value distribution of t-tests comparing bovine ESFs with and without co-culture with F3 trophoblast cells. In both C and D, note that thin right hand tail of the distribution, which indicates that a large number of genes are differentially expressed in response to the presence of the corresponding trophoblast cells. (E-F) Scatter plots showing relative TPM values of genes between (E) hESF and hESF co-cultured with HTR8, and (F) bESF and bESF co-cultured with F3; Red dots refer to individual gene transcripts abundance significantly different in between the compared conditions.

