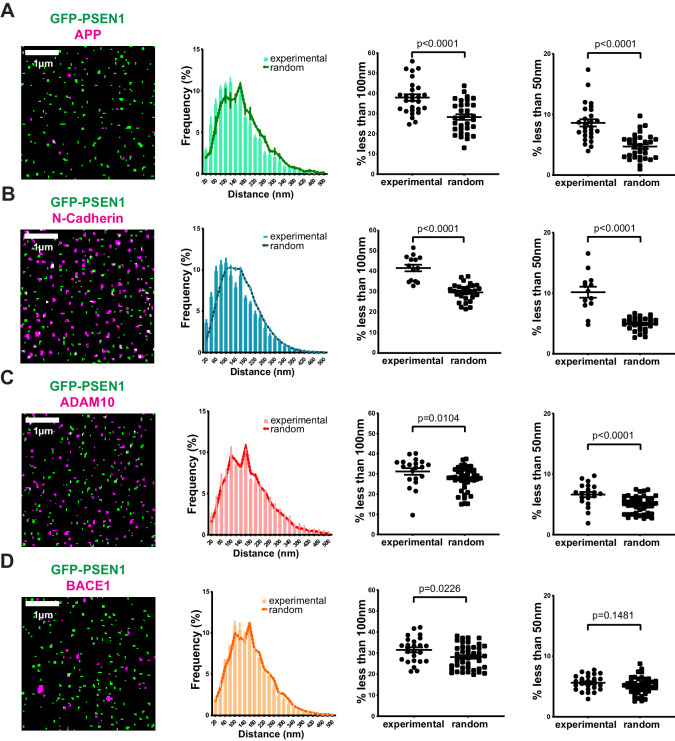
Figure 4. Correlation of PSEN1/γ-secretase complexes with substrates and sheddases at the cell surface.
(From left to right) SIM mask, nearest-neighbor distances distribution, percentage of spots present at a distance <100 nm and percentage of spots present below 50 nm. Each dot represents one cell. (A) Distance of endogenous APP and (B) N-cadherin to GFP-PSEN1 shows a clear association to PSEN1 (mean ± SEM, n = 27 cells and n = 14 cells, respectively). (C) ADAM10-SNAP distance to GFP-PSEN1 shows a limited association to PSEN1 (mean ± SEM, n = 20 cells) whereas (D) BACE1-SNAP distance to GFP-PSEN1 shows no association to PSEN1 (mean ± SEM, n = 25 cells). All comparison analysis by two-tail Mann-Whitney test. See Figure 4—source data 1.

