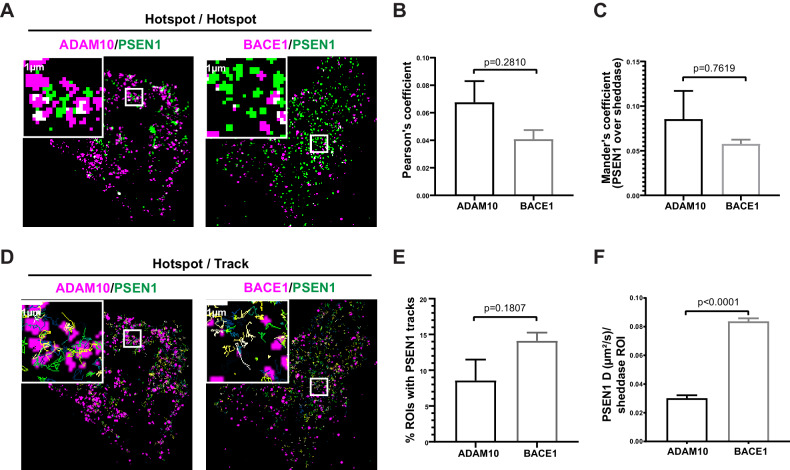
Figure 5. GSI-sensitive PSEN1/γ-secretase hotspots do not overlap with those of sheddases.
(A) Diffraction-limited hotspots of SNAP tagged-sheddases and mEOS3.2-PSEN1 show limited overlap (white). Scale bar = 1 µm. (B) Pearson’s coefficient of ADAM10 and BACE1 hotspots associated with PSEN1 hotspots show very low correlation. Comparison analysis by two-tail Mann-Whitney test (mean ± SEM, BACE1 n = 4 cells; ADAM10 n = 6 cells). (C) Mander’s coefficient of PSEN1 hotspots over ADAM10 or BACE1 hotspot showed limited overlap. Comparison analysis by two-tail Mann-Whitney test (mean ± SEM, BACE1 n = 4 cells; ADAM10 n = 6 cells). (D) Tracks of mEOS3.2-PSEN1 show some association with diffraction-limited hotspots of SNAP tagged-sheddases. Scale bar = 1 µm. (E) Percentage of sheddases hotspots associated with mEOS3.2-PSEN1 tracks show a tendency for higher association with BACE1 hotspots. Comparison analysis by two-tail Mann-Whitney test (mean ± SEM, BACE1 n = 7 cells; ADAM10 n = 6 cells) (F) Diffusion coefficient analysis of pooled tracks associated with a sheddase-hotspot shows a significantly decreased diffusion coefficient for tracks on ADAM10-SNAP, but not for tracks on BACE1 hotspots. Comparison analysis by two-tail Mann-Whitney test (mean ± SEM, BACE1 = 263 tracks, n = 7 cells; ADAM10 = 126 tracks, n = 6 cells each).

