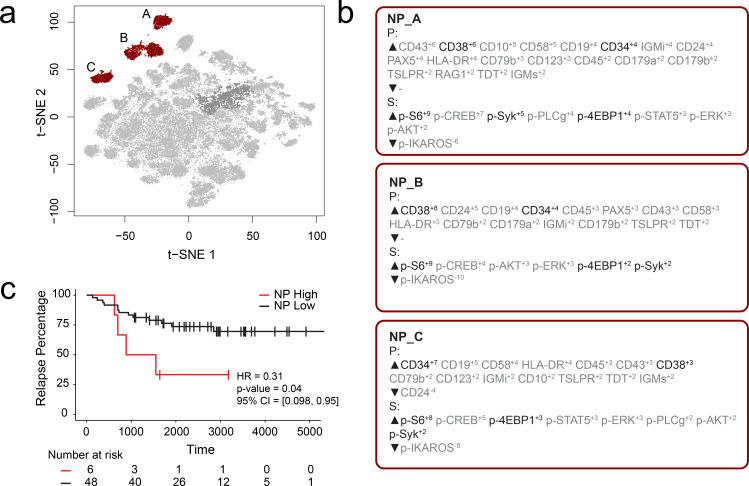
Figure 2. RAPID analysis of a published B-cell leukemia dataset to identify negative prognostic cell subsets.
(a) t-SNE plot of 54 B-cell leukemia patient samples with negative prognostic populations (A, B, C) colored in red. (b) MEM labels for three negative prognostic cell subsets (NP_A, NP_B, NP_C). Features important in the original discovery of predictors of relapse are colored in black. (c) Kaplan-Meier Curve comparing time to relapse in patients with high abundance of negative prognostic cells (identified by RAPID) to patients with low abundance of negative prognostic cells.

