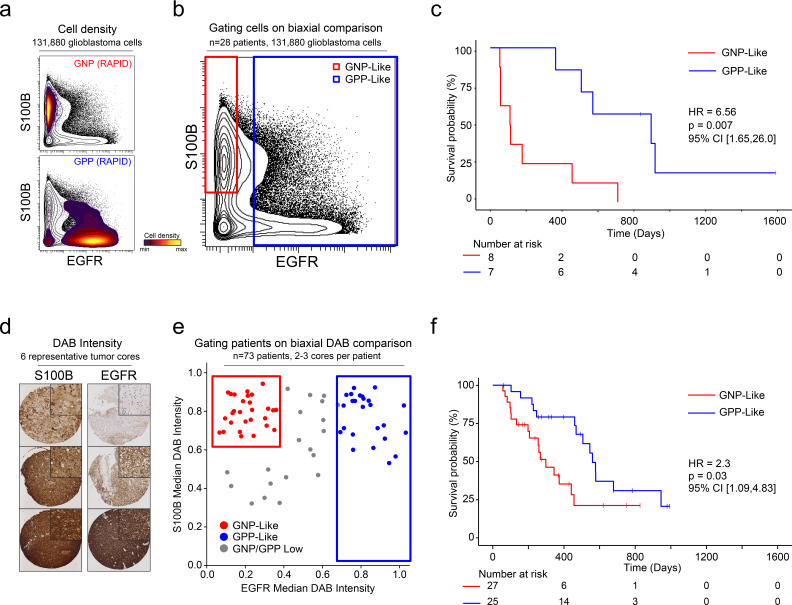
Figure 5. A simple gating strategy based on S100B and EGFR can stratify patients using mass cytometry or immunohistochemistry data.
(a) Biaxial plot of S100B (y-axis) and EGFR (x-axis). Gray contours depict all 131,880 cells from all patients. Density contour overlays depict GNP (top) or GPP (bottom) cells identified by the RAPID algorithm. (b) Biaxial plot of S100B (y-axis) and EGFR (x-axis). Gray contours depict all 131,880 cells from all patients as in (a). Red box indicates gate for S100B+/EGFR- cells, called GNP-like. Blue box indicates gate for EGFR+ cells, called GPP-like. (c) Kaplan Meier curve comparing overall survival (in days) of patients with high percentages of GNP-like cells in red (red gate in a, >65.7% = high) and patients with high percentages of GPP-like cells in blue (blue gate in a, >31.2% = high). The hazard ratio of death, calculated using a Cox proportional hazards model, is 6.56 (p=0.0007). (d) Example TMA cores stained for S100B (left) or EGFR (right). Brown signal is from 3,3′-Diaminobenzidine (DAB). (e) Graph depicting DAB signal intensity for S100B (y-axis) or EGFR (x-axis) from tissue microarray immunohistochemistry on 73 glioblastoma patient samples. The red box outlines patients described as GNP-like (S100Bhigh/EGFRlow) and the blue box outlines patients designated GPP-like (EGFRhigh). All other patients are shown in gray. (f) A Kaplan-Meier curve showing overall survival (in days) of patients in the GNP-like (red) or GPP-like (blue) groups. The hazard ratio of death, calculated using a Cox proportional hazards model, is 2.3 (p-value=0.03).

