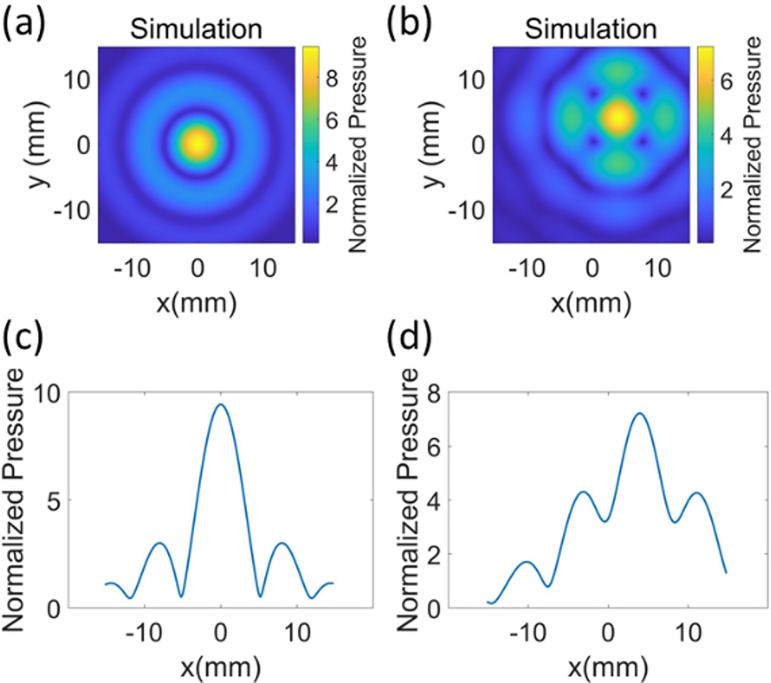
FIG. 4.
(Color online) To obtain a larger focus with IASA, the target images were set similar to circles in Fig. 1(c) with diameters ranging between 6 and 20 mm. When the diameter of the circle in the target image was 6 mm, the simulated pressure field was matched to the pressure profile of a conventional focused transducer. (a) and (c) The images show results of the simulation of a target image with a 1-mm diameter. When the diameter of the circle in the target image was varied from 6 to 20 mm, the beam width in the simulated results did not increase. (b) The image in the center of the circle with an 18-mm diameter in the desired image was shifted to (4 mm, 4 mm). Introducing asymmetry in the target pressure profile changed the shape of outputs. The image in (d) shows a line plot along the x axis at y = 4 mm. The results are normalized with respect to the surface pressure of the source.

