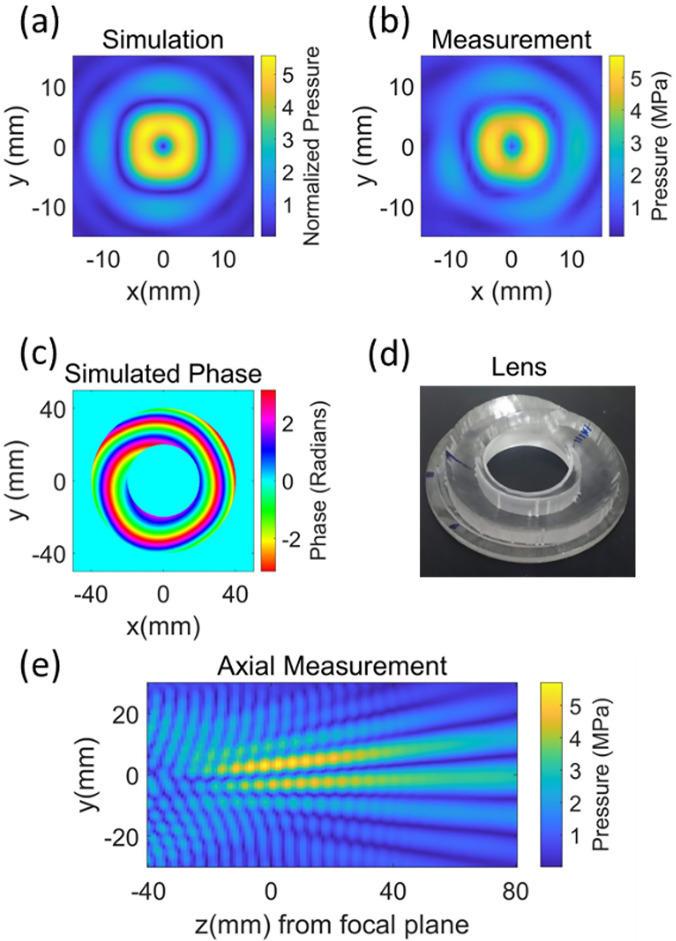
FIG. 5.
(Color online) The optimized beam pattern was obtained when the target image was set similar to Fig. 1(d) and parameters such as the location of the centers of circles, asymmetric shift in the center of the circles, and diameters of the circles were varied. The image in (a) shows simulated results for small circles with a 6-mm diameter and centers located at (±3–3.5 mm, ±3–3.5 mm), and the center of the target image was shifted to (3.5 mm, 3.5 mm). The results in (a) are normalized with respect to surface pressure of the source. The focal plane of the transducer was scanned to confirm the simulation and the measured (peak negative pressure) result is shown in (b). The image in (c) shows the phase profile of the source, which produces the beam pattern. The image in (d) shows the lens encoding phase in (c). The image in (e) shows the peak negative pressure measurement in axial direction with z = 0 in the focal plane. The simulated results are normalized with respect to the surface pressure of the source.

