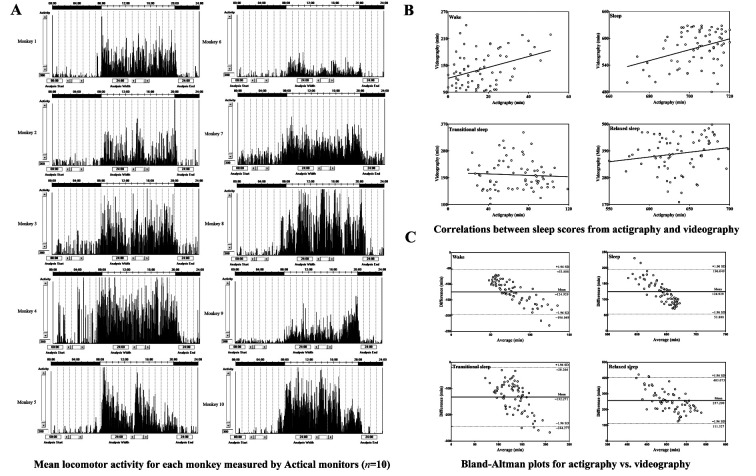
Figure 1. Locomotor activity, correlations, and Bland-Altman plots.
A: Mean locomotor activity for each monkey measured by Actical monitors (n=10). Activity data were collected over a seven-day period and are presented as means over that period. Lights were on at 0800 h and off at 2000 h. B: Correlations between sleep scores from actigraphy and videography. Four states were scored by actigraphy (X-axis: Actigraphy) and videography analysis (Y-axis: Videography), respectively, including wake, sleep, transitional sleep, and relaxed sleep. C: Bland-Altman plots for actigraphy vs. videography. X axes represent average of two methods ((actigraphy+videography)/2) and Y axes show differences between two paired measurements (actigraphy–videography), including wake, sleep, transitional sleep, and relaxed sleep. Solid lines show mean differences between actigraphy and videography measurements; dotted lines represent 95% limits of agreement, from –1.96 SD (standard deviation) to +1.96 SD.

