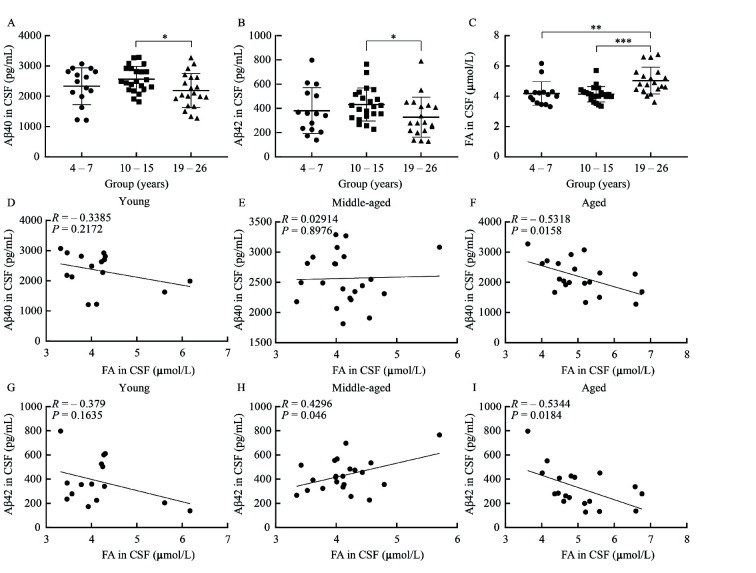
Figure 1. Intergroup analyses of Aβ40, Aβ42, and FA concentrations in CSF, and correlations between CSF Aβ and FA concentrations in young, middle-aged, and aged rhesus monkeys .
A: Intergroup analyses of Aβ40 concentrations. B: Intergroup analyses of Aβ42 concentrations. C: Intergroup analyses of FA concentrations. D: Correlation between CSF Aβ40 and FA concentrations in young group (R=–0.3385, P=0.2172). E: Correlation between CSF Aβ40 and FA concentrations in middle-aged group (R=0.02914, P=0.8976). F: Correlation between CSF Aβ40 and FA concentrations in aged group (R=–0.5318, P=0.0158). G: Correlation between CSF Aβ42 and FA concentrations in young group (R=–0.379, P=0.1635). H: Correlation between CSF Aβ42 and FA concentrations in middle-aged group (R=0.4296, P=0.046). I: Correlation between CSF Aβ42 and FA concentrations in aged group (R=–0.5344, P=0.0184). Error bars indicate mean± standard deviation (SD). *: P<0.05, **:P<0.01, ***:P<0.001. Aβ: β-amyloid; CSF: Cerebrospinal fluid.

