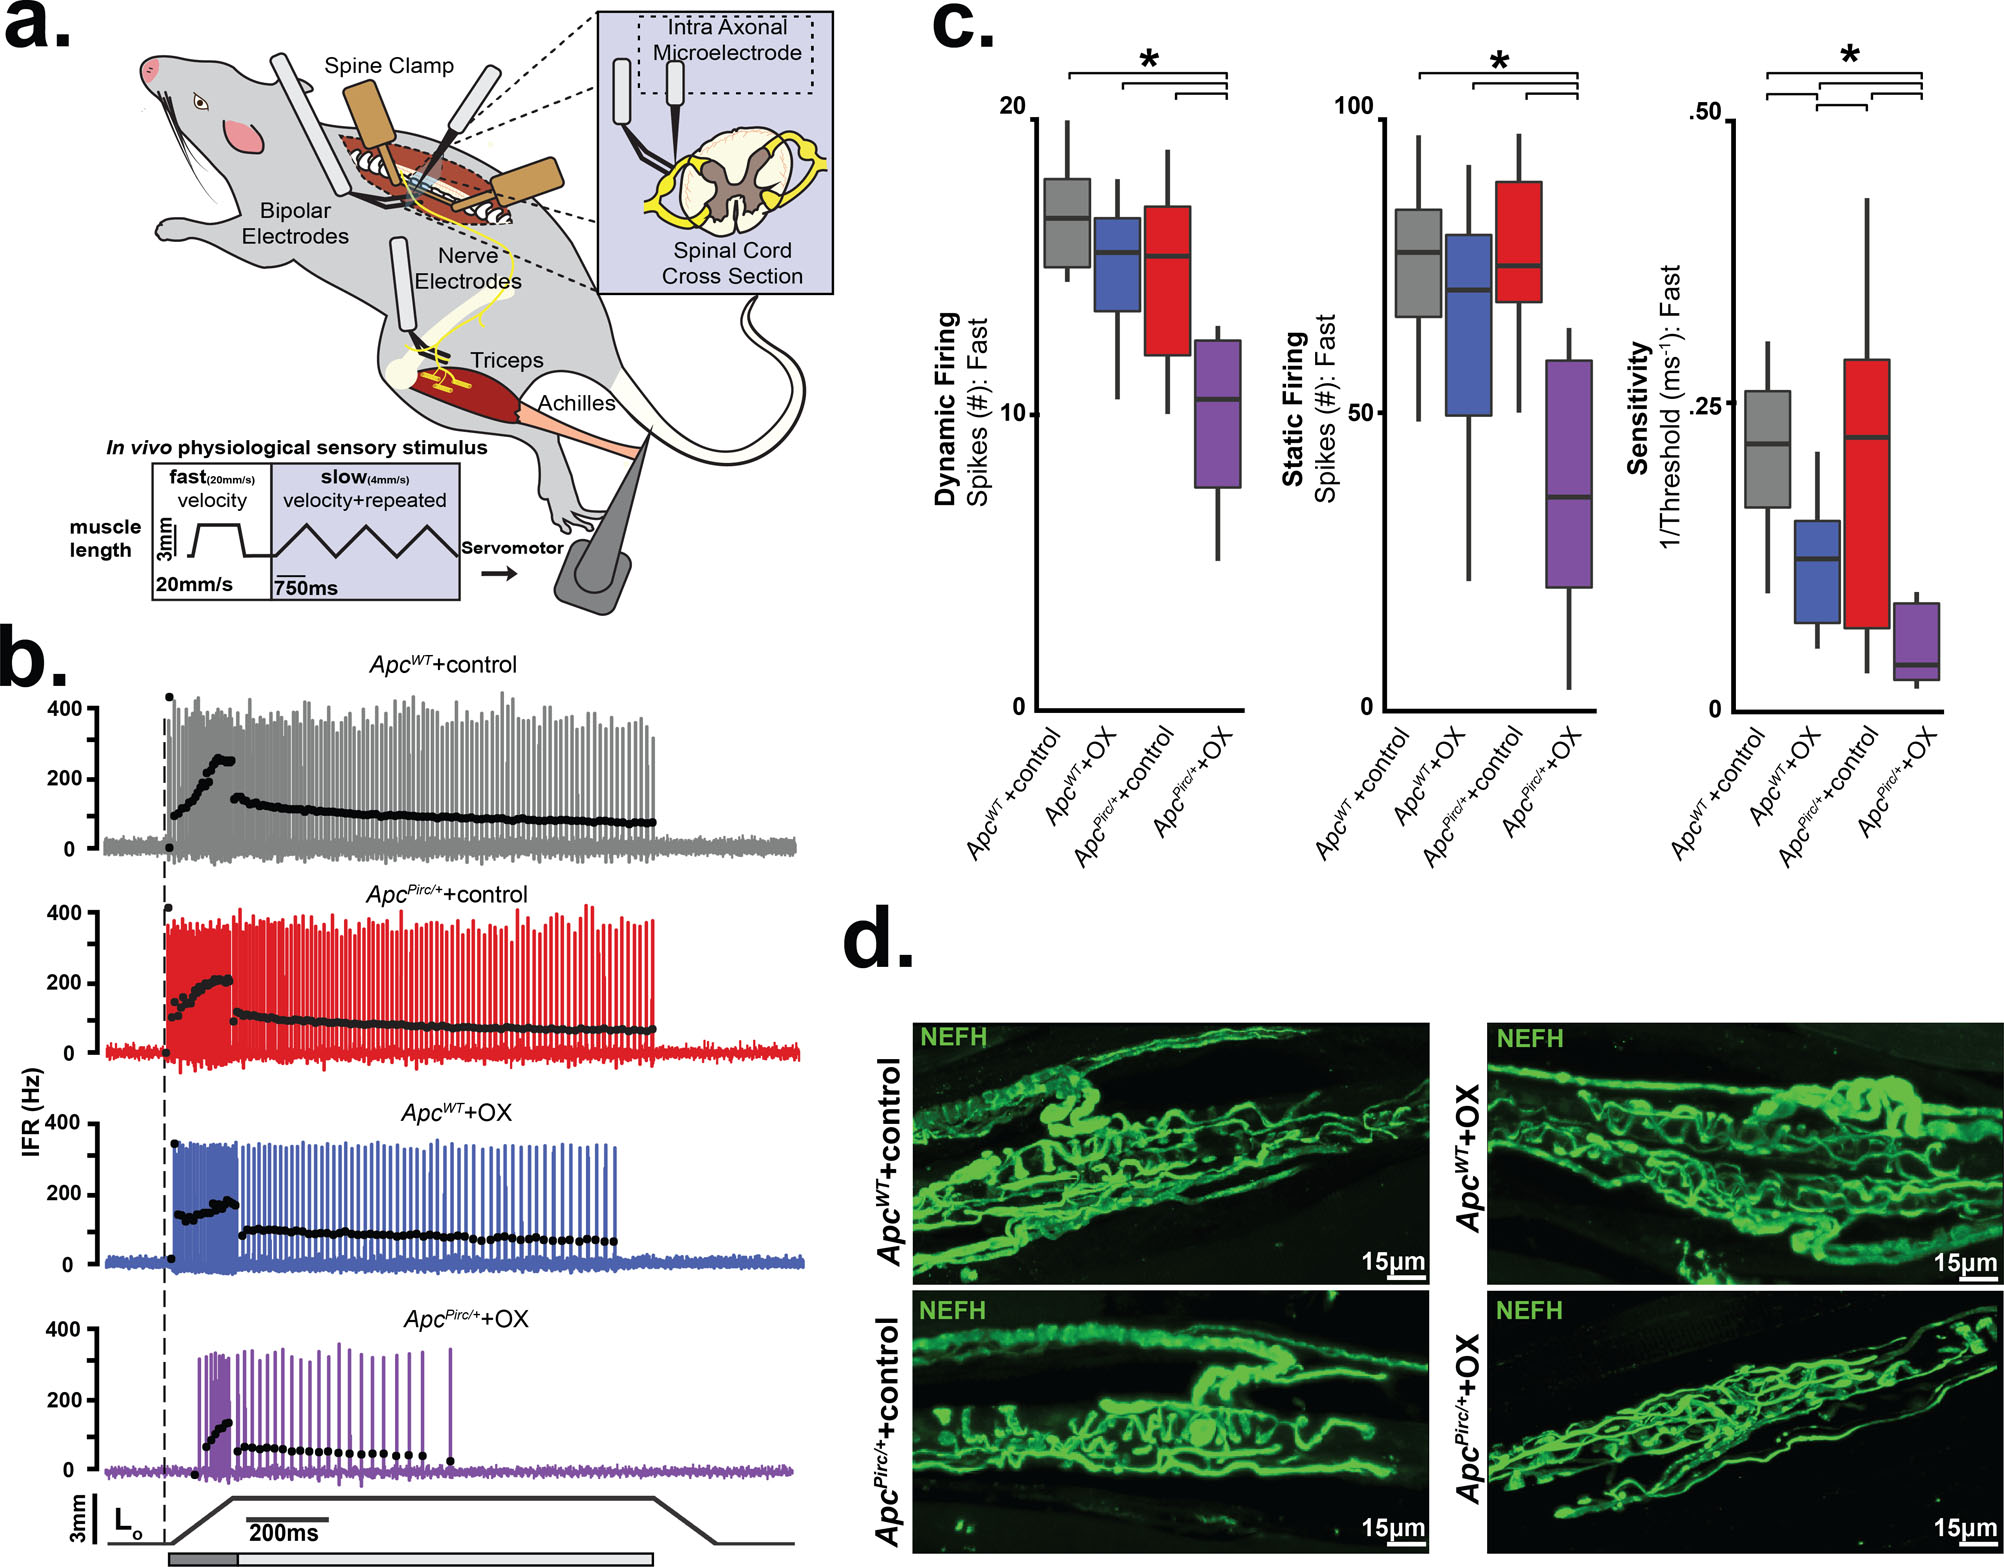
Figure 5. Mechanosensory signal degradation exacerbated by the cancer–chemotherapy interaction.

a, Diagram of anesthetized rat stabilized in spine clamps for physiological recordings of triceps surae (medial and lateral gastrocnemius and soleus) muscles and nerves. Records taken intra-axonally from single mechanosensory neurons in lumbosacral dorsal roots (L4-S1) while applying fast (20 mm/second). b, Representative cases of spiking activity in ApcWT+control, ApcWT+OX, ApcPirc/++control, and ApcPirc/++OX as a measure of sensory encoding. Black circles plot instantaneous firing rates (pps) of corresponding spike (action potential) intervals. Dashed vertical line marks onset of muscle stretch (3mm from resting length (Lo)) shown in bottom trace divided into dynamic and static phases by dark grey (150 ms duration after stretch command onset) and light grey (1 s duration after the dynamic phase) bars. c, Neuronal spiking parameters (n=31 averaged from four trials in each neuron, four shown from fast ramp stimulus) representing different features of sensory stimulus (ApcWT+control (n = 11), ApcWT+OX (n = 19), ApcPirc/++control (n = 20) and ApcPirc/++OX (n = 10)): mean initial burst frequency (pps) signaling stretch onset; the number of spikes during dynamic sensory stimulation (shown as a dark grey bar in b); the number of spikes during static sensory stimulation (shown as a light grey bar in b); sensitivity assessed as the inverse of latency to stimulus detection (ms-1), i.e. lower sensitivity corresponds to longer latency and higher threshold. d, Confocal image of a neurofilament heavy-chain (NEFH, in green) with immunolabeling of the terminal axon and receptor structure in ApcWT+control, ApcWT+OX, ApcPirc/++control, and ApcPirc/++OX rats. Scale bar, 15 μm. * indicates statistically significant differences between experimental groups as empirically derived from hierarchical Bayesian model (stan_glm): 95% highest density intervals do not overlap between groupwise contrasts. Data presented as mean±s.e.m.
