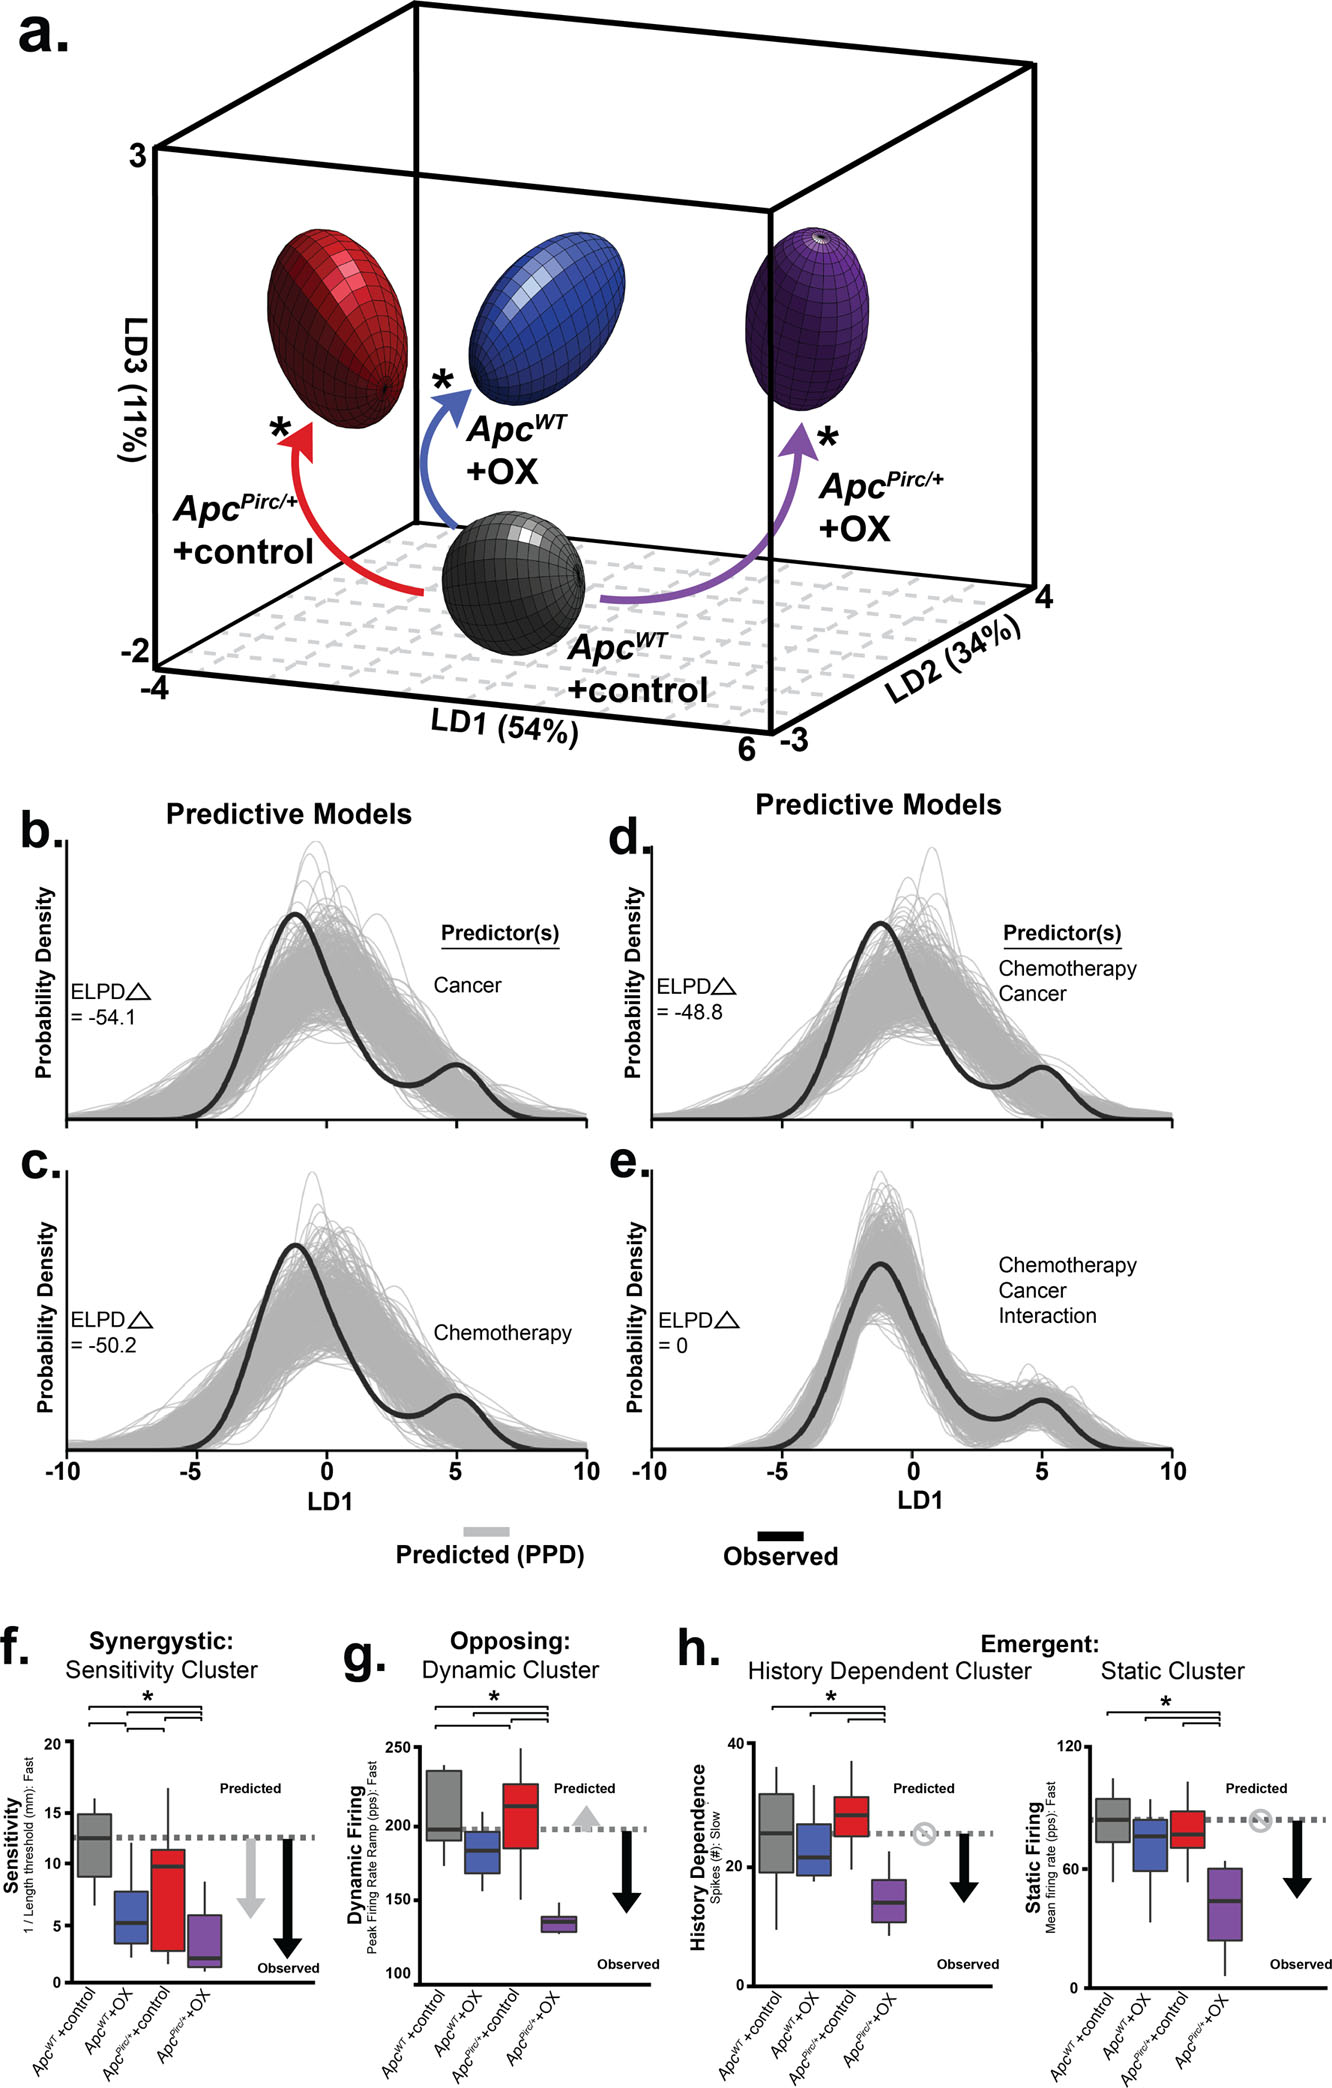
Figure 6. Cancer-chemotherapy codependence exacerbates sensory dysfunction beyond that predicted by cancer or chemotherapy alone.

a, Neuronal spiking parameters (n=31, averaged from four trials, from each neuron (n=60)) representing different features of sensory stimuli were subjected to linear discriminant (LD) analysis. Neuronal signaling was visualized in the new 3D composite space created by LD1–3. 3D ellipsoids enclosing 68% of data were computed with least-squares elliptical fitting to emphasize differences between control and ApcPirc/++OX neurons. Effects of independent (OX or ApcPirc/+) and combinatorial (ApcPirc/++OX) treatment are indicated by curved arrows. b-e, the hierarchical Bayesian model used to test for significant group differences in LD1 scores reconfigured to operate in a predictive fashion. Predictors included in each model are listed to the right of each plot. Generative models in (b-d) utilizing one (b, c) or both independent (d) predictor(s), i.e. cancer (ApcPirc/+) or chemotherapy (OX) for posterior prediction. The generative model in (e) utilizes both independent predictors and an interaction term for posterior prediction. Grey lines in b-e represent 500 novel (generative) samples drawn from the posterior distributions. Black lines illustrate experimentally observed mean LD1 score. Predictive accuracy was measured by calculating expected log predictive density (ELPD) for each model and benchmarked off of the highest performing model. Delta ELPD (Δ symbol) indicates difference from optimal model. Negative models represent worse predictive performance. f, Sensitivity assessed as the inverse of latency to stimulus detection (mm-1), i.e. lower sensitivity corresponds to longer latency and higher threshold. g, Peak firing rate (pps) achieved during the dynamic sensory stimulus (shown as dark grey bar in Fig. 5b). h, change in dynamic spike number in successive, slow stretch dynamic sensory stimulus and mean firing rate (pps) achieved during the static sensory stimulus (shown as light grey bar in Fig. 5b). Recordings were analyzed from ApcWT+control (n = 11), ApcWT+OX (n = 19), ApcPirc/++control (n = 20) and ApcPirc/++OX (n = 10) in b-g, * indicates statistically significant differences between experimental groups as empirically derived from hierarchical Bayesian model (stan_glm). Grey arrows in f-h indicate direction and significant differences from ApcWT+control predicted from the linear sum of the independent effects of ApcWT+OX and ApcPirc/++control groups. Black arrows indicate experimentally observed effects of their combination. Circles with slashes indicated no difference predicted for ApcWT+OX group and ApcPirc/++control groups. Data presented as mean ± s.e.m.
