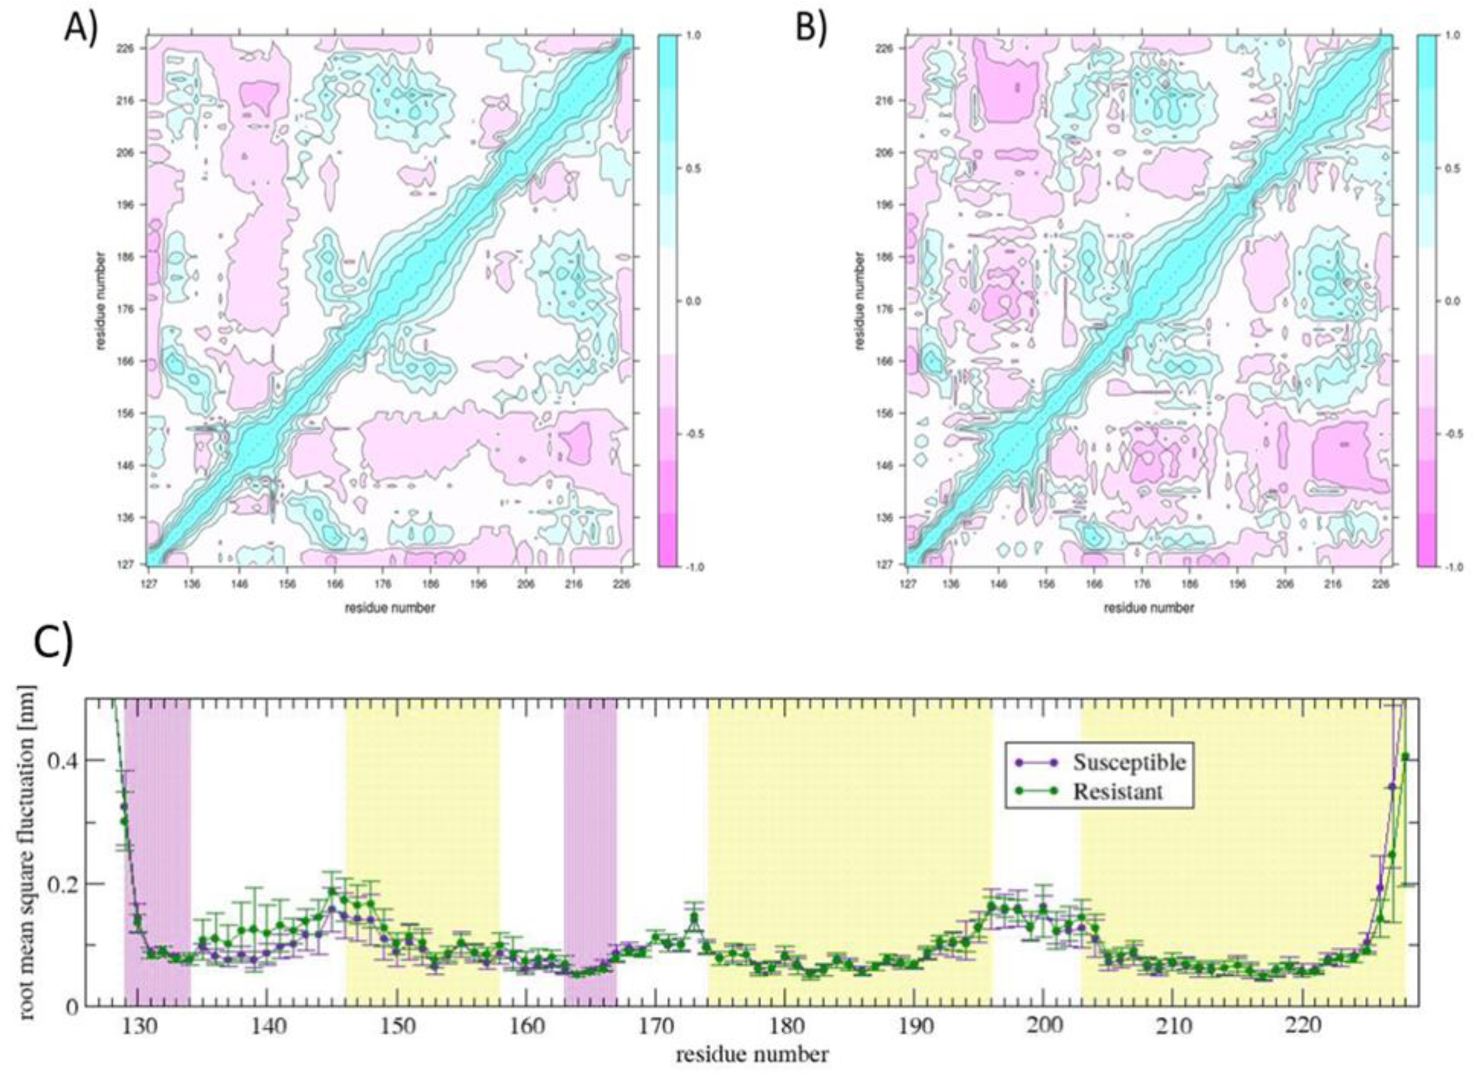
Figure 4.

Dynamic cross correlation matrix of the A) Susceptible and B) Resistant structure; C) root mean square fluctuation plot of each residue of the Susceptible and Resistant structure. The local density of inter-residue connectivity, represented by the dynamic cross correlation matrix, indicates local differences when comparing the Susceptible with the Resistant structure. The most striking difference is the increased local conformational mobility in the β1-α1 loop in the Resistant structure.
