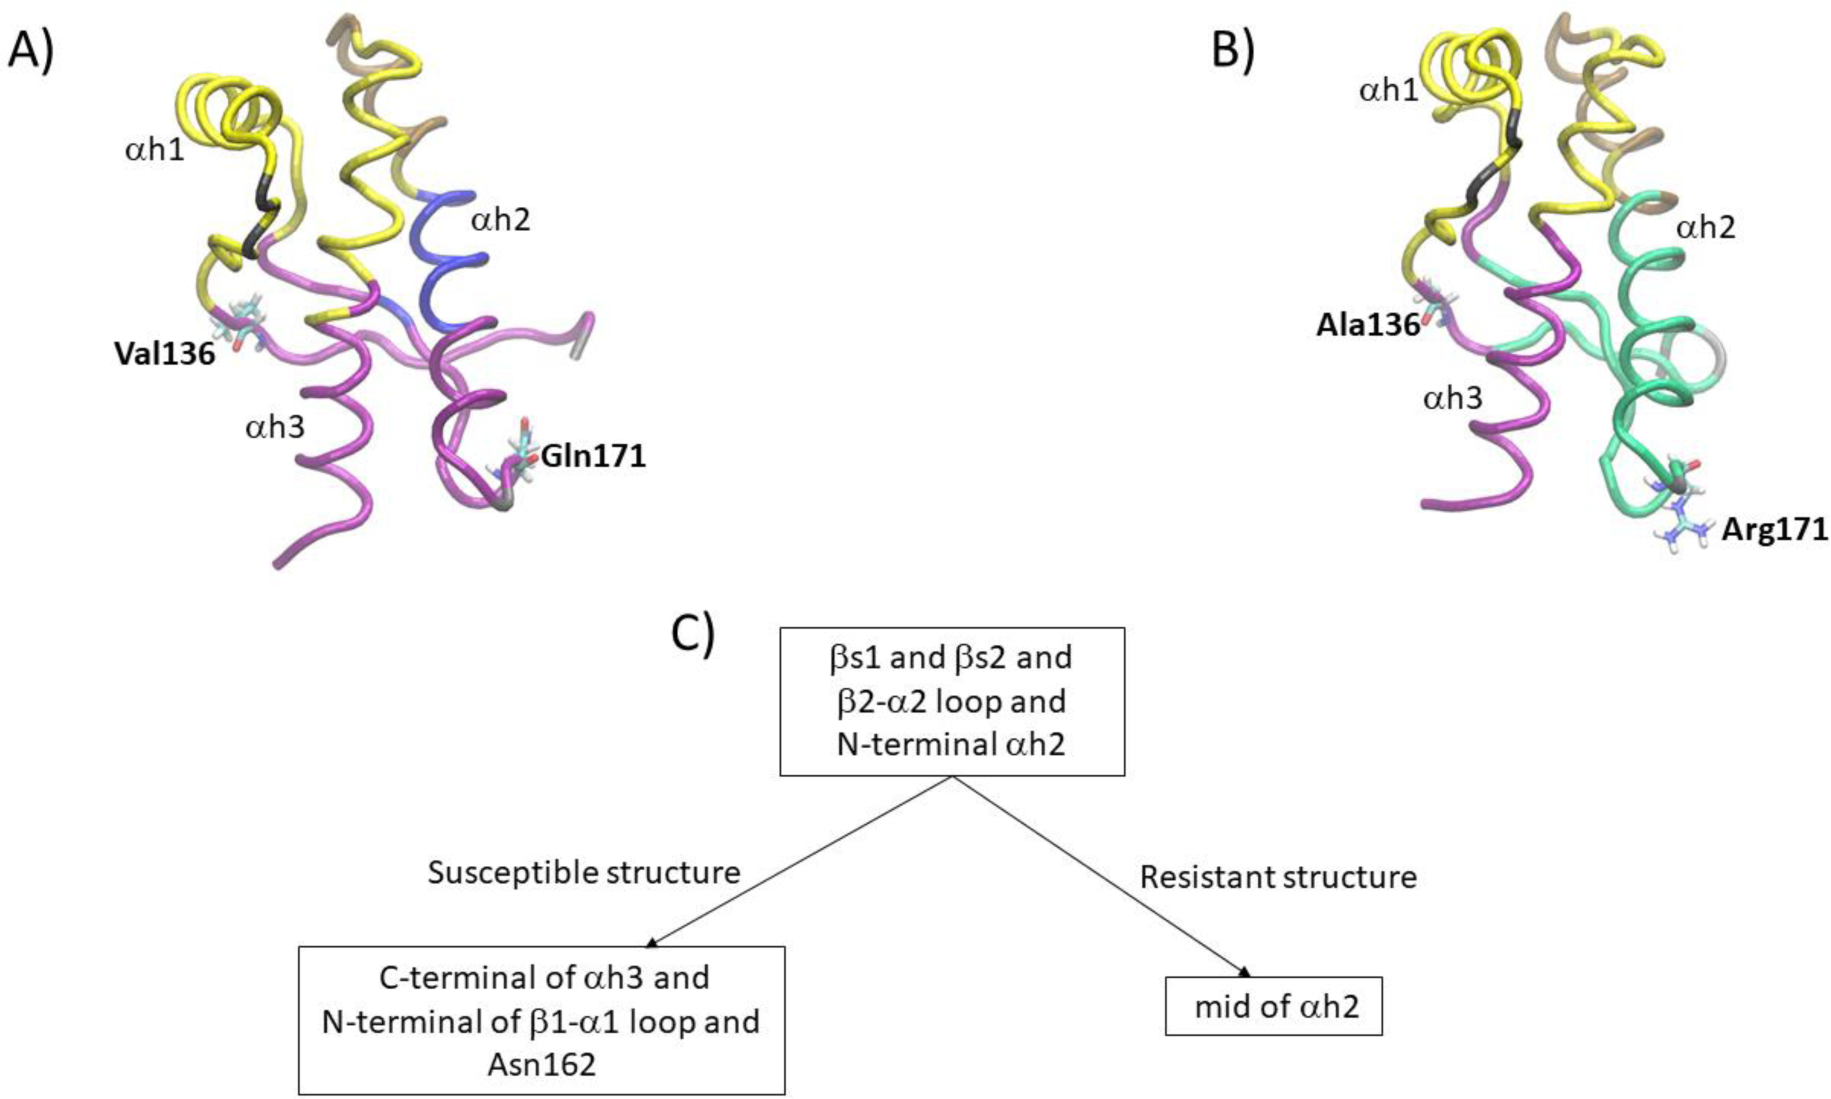
Figure 5.

Representation of the partitioning into communities of the residue network of A) Susceptible and B) Resistant structure; C) illustration of the distinct partitioning of a key community of the Susceptible and Resistant structure. The β2–α2 loop of the Resistant structure shows stronger connectivity with the N-terminal of α–helix 2 than the Susceptible structure. The connectivity between the β–sheets and α–helix 3 present in the Susceptible structure is lost in the Resistant structure.
